
TL;DR: Kixie KAI is Kixie’s built-in AI reporting assistant for sales dashboards, available on every Kixie plan at no extra cost, letting managers ask plain-English questions from any dashboard and get live visual reports within seconds, while AI sales dashboards overall connect to telephony and CRM tools, transcribe calls in real time, and surface calls placed, live connects, speed-to-lead, meetings booked, conversion rate, pipeline created, call outcomes, rep trends, coaching moments, and deal-risk alerts. The key conversation benchmark is a 43 percent seller talk to 57 percent buyer listen ratio from a 25,537-call study, equal to about 23 buyer minutes in a 40-minute discovery call, while a 75-to-25 pattern can flag coaching needs around questioning and active listening. Managers should also track question rate, interactivity, pipeline velocity, open opportunities, average deal size, win rate, sales cycle length, lead-to-customer conversion calculated as new customers divided by total leads times 100, and risk signals including pricing or budget mentions, competitor mentions, missing next steps, decision-maker language, negative sentiment, and repeated objections. Platform comparisons include Kixie with custom pricing, multi-line power dialer, local presence dialing, voicemail drop, SMS, call recording, and native HubSpot, Salesforce, Pipedrive, and Zoho integrations, Dialpad at $15 to $25 per user per month for standard tiers with custom enterprise AI sales pricing, live call routing, real-time transcription, Real-Time Assist cards, live coaching, and basic sentiment analysis, Salesloft at roughly $100 to $133 per user per month or $20,000 to $120,000 annual packages with outbound email cadences, built-in dialing, CRM logging, pipeline forecasting, and $1 per phone number per month, and Gong at $50,000 per year platform fee plus $1,600 per user per year, with Gong Engage or Gong Forecast adding $700 to $800 per user per year, 99 percent interaction capture, detailed talk-to-listen analytics, deal-risk alerts, and advanced revenue forecasting. Pricing, ROI, implementation timelines, and call recording rules vary by provider, workflow, and jurisdiction, so teams should verify current terms before rollout.
The modern sales operation produces a massive amount of data. Sales development representatives make dozens of phone calls each day, send hundreds of emails, and log various updates into their customer relationship management software. In the past, revenue operations leaders had to manually export this data into spreadsheets to understand team performance. Today, an AI sales dashboard automates this entire process. It connects directly to your sales telephony tools, transcribes phone calls as they happen, and displays the most important metrics on a single screen.
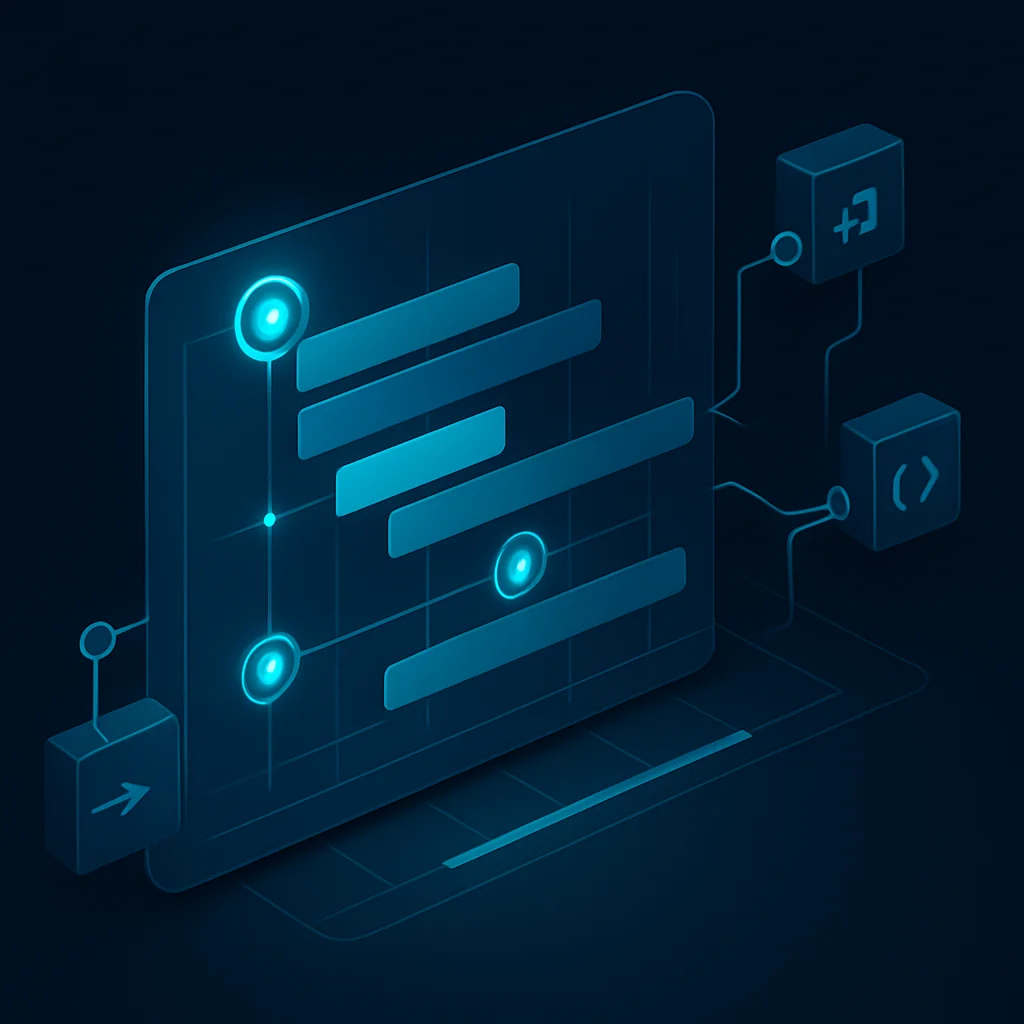
A practical manager view should make the next action obvious at a glance. Common widgets include calls placed, live connects, speed-to-lead, meetings booked, conversion rate, pipeline created, call outcomes, rep activity trends, coaching moments, and deal-risk alerts. SDR leaders may prioritize activity and connect rates, account executive managers may focus on pipeline movement and buyer sentiment, RevOps may monitor data quality and forecasting inputs, and executives may prefer high-level revenue and productivity trends.
For sales professionals and managers evaluating these tools, the options can seem overwhelming. A properly configured dashboard does more than just count how many calls a representative made. It uses artificial intelligence to analyze the content of those calls, predict which deals are likely to close, and identify specific coaching opportunities. This report will explore the exact metrics managers should track, compare the top software platforms by features and price, demonstrate how to calculate a realistic return on investment, and outline the strict legal rules teams must follow when recording calls.
AI sales dashboard metrics to track
A reliable AI sales dashboard replaces basic activity counting with deeper sales analytics and reporting. Instead of only showing call volume, it helps managers review how representatives engage buyers, where conversations stall, and which activities are connected to pipeline movement.
At a glance, a practical manager dashboard should make the most important sales signals easy to scan, such as:
- Calls placed, connects, meetings booked, and call outcomes
- Speed-to-lead, follow-up activity, and response trends
- Talk-to-listen ratio, question rate, and other conversation quality indicators
- Conversion rates by stage, pipeline created, and open deal risk signals
- Coaching alerts that point managers to calls or reps needing review
The best view depends on the team. SDR leaders may prioritize connects and meetings, account executive managers may focus on deal progression and buyer signals, and RevOps teams may care most about data quality, attribution, and forecast visibility.
Sales talk to listen ratio
One of the most useful metrics displayed on an AI sales dashboard is the talk-to-listen ratio. This metric measures the percentage of a phone call that the sales representative spends speaking compared to the percentage of time the potential buyer speaks.
A commonly cited benchmark from AI-based analysis of B2B sales calls is a 43 to 57 talk-to-listen ratio, meaning the representative speaks for 43 percent of the call and the buyer speaks for 57 percent. Managers should treat this as a coaching baseline rather than a universal rule, because ideal ratios can vary by call type, deal stage, and buyer context.
An AI sales dashboard can calculate this metric automatically by identifying each speaker, adding up the total seconds the agent spoke, and comparing that with the total call length. For example, in a 40-minute discovery call, a 43 to 57 ratio would mean the buyer speaks for roughly 23 minutes. If a manager sees a representative consistently averaging a 75 to 25 ratio on discovery calls, that may signal a need for coaching on question quality, active listening, and buyer-led conversation flow.
Sales question rates and interactivity
Beyond simply measuring silence, an AI sales dashboard can help managers see how often a conversation switches back and forth between the buyer and the seller. This is commonly treated as an interactivity signal: a call with regular turns from both sides is usually more collaborative than a long, one-sided presentation.
Depending on the platform, interactivity may be shown as a score, trend line, or coaching flag. Managers can use this view to spot calls where a representative dominates the conversation, misses buyer cues, or fails to create space for discovery.
Question rate is the companion metric. Instead of looking only at how many questions a representative asks, review whether those questions help uncover pain, urgency, decision criteria, budget, and next steps. The most useful AI sales dashboard view compares question patterns by rep, team, call stage, and outcome so managers can coach specific behaviors rather than relying on a generic pass-fail benchmark.
Pipeline metrics and conversion rates
An AI sales dashboard connects conversational metrics to revenue outcomes. Revenue operations teams use the dashboard to track pipeline velocity, which measures how quickly qualified opportunities move through the sales funnel.
A practical pipeline view should show the inputs behind the number, not just the final total. Managers can monitor widgets such as open opportunities, average deal size, win rate, sales cycle length, meetings booked, call outcomes, and pipeline created by rep or team.
The dashboard should also track the standard lead-to-customer conversion rate, which is calculated by dividing the number of new customers by the total number of leads, then multiplying by 100. Watching this trend over time helps managers see whether coaching, messaging changes, or follow-up improvements are translating into more closed deals.
- SDR leaders: prioritize speed-to-lead, connect rate, meetings booked, and lead-to-meeting conversion.
- AE managers: prioritize opportunity conversion, deal stage movement, average deal size, and close rate.
- RevOps teams: prioritize pipeline velocity, source attribution, forecast changes, and data quality.
- Executives: prioritize total pipeline created, revenue forecast, win rate, and sales cycle trends.
Sales deal risks and buyer signals
An AI sales dashboard is most useful when it turns call activity into specific deal-risk indicators. Instead of only showing total calls or talk time, managers can review recurring topics, objections, sentiment changes, next-step mentions, and other buyer signals that may require coaching or follow-up.
Common risk and signal widgets include:
- Pricing or budget mentions: Helps managers see when cost becomes a central part of the conversation.
- Competitor mentions: Flags calls where buyers compare alternatives, so teams can review positioning and objection handling.
- No next step identified: Highlights conversations that may need a clearer follow-up plan.
- Decision-maker language: Surfaces references to approval processes, additional stakeholders, or internal review.
- Negative sentiment or repeated objections: Helps managers prioritize coaching moments and deal support.
For coaching, managers can use these signals to build focused review lists. For example, a weekly review could filter calls that mention a competitor, pricing, or missing next steps, then use the relevant call moments to improve talk tracks and follow-up quality.
Best AI sales dashboard platforms
AI sales dashboard pricing
The following table provides a neutral comparison of three major platforms frequently evaluated by sales leaders. Pricing and features are based on recent procurement benchmarking data and vendor information.| Software Platform | Target Audience | Estimated Pricing | Key Telephony and Dashboard Features |
|---|---|---|---|
| Kixie | Small to enterprise teams needing a power dialer with CRM integration | Custom pricing based on team size and feature requirements. Contact Kixie for a quote. | Multi-line power dialer, local presence dialing, voicemail drop, SMS, call recording, and native CRM integrations with HubSpot, Salesforce, Pipedrive, and Zoho. |
| Dialpad | Small to mid-sized teams needing a unified phone system | $15 to $25 per user per month for standard tiers. Enterprise pricing is custom. | Unified communications platform, live call routing, real-time transcription, live agent coaching cards, and basic sentiment analysis. |
| Salesloft | Mid-market to enterprise teams focused on email and call outreach | Roughly $100 to $133 per user per month. Often sold in annual packages of $20,000 to $120,000 depending on team size. | Advanced outbound email sequencing, integrated dialing, pipeline forecasting, and automated CRM data logging. |
| Gong | Enterprise teams focused strictly on deep conversation intelligence | $1,600 per user per year, plus a required $50,000 annual platform fee. | Best-in-class AI call analysis, detailed talk-to-listen ratios, automated deal risk alerts, and advanced revenue forecasting. |
Dialpad sales dashboard features
Dialpad is primarily a cloud-based business communications platform. It replaces traditional desk phones with a digital application that handles voice calls, video meetings, and text messaging all in one place. Because it is a unified communication tool, the phone system and the AI analytics live in the exact same application. For sales teams, Dialpad offers a product called Dialpad Sell. This system is unique because it focuses heavily on real-time assistance. As a representative speaks to a buyer on the phone, the AI transcribes the call live. If the buyer asks a difficult question about a competitor, Dialpad can automatically pop a Real-Time Assist card onto the representative’s screen. This card provides a script or bullet points to help the representative answer the question correctly in the moment. Pricing for Dialpad is generally more accessible for smaller teams. Standard business communication plans range from $15 to $25 per user per month. However, access to the advanced AI sales center features usually requires a custom enterprise quote.Gong sales dashboard features
Gong takes a different approach. Rather than acting as your phone provider, Gong connects to your existing phone systems, video conferencing tools, and email accounts. It quietly records these interactions, imports the data into its platform, and runs massive artificial intelligence models to analyze the conversations. Gong is widely recognized for having highly accurate conversation intelligence. It is the tool that tracks the specific 43 to 57 talk-to-listen ratios and flags at-risk deals. Gong captures 99 percent of customer interactions and links them directly to records in your customer relationship management software, such as Salesforce or HubSpot. However, Gong is a premium enterprise tool, and its pricing reflects that status. According to recent software procurement data, Gong charges a baseline platform fee of $50,000 per year just to access the software. On top of that fee, each user license costs an estimated $1,600 per year. Additional features, like Gong Engage or Gong Forecast, cost an extra $700 to $800 per user per year. Because of the $50,000 base fee, Gong is typically too expensive for small startups and is better suited for large corporate sales teams.Salesloft sales dashboard features
Salesloft sits somewhere between a communication tool and an analytics dashboard. It is a revenue orchestration platform designed to help sales development representatives organize their daily tasks. If a representative needs to call a prospect on Monday, send an email on Wednesday, and message them on LinkedIn on Friday, Salesloft organizes all of these steps into an automated cadence. It tells the representative exactly who to contact next and provides a built-in dialer to make the phone call directly from the computer screen. While Salesloft does offer conversation analysis and pipeline forecasting, its primary strength is helping representatives execute high volumes of outbound tasks quickly. Pricing for Salesloft is not publicly listed on their website, but third-party procurement data estimates that a 50-person sales team will typically pay between $60,000 and $80,000 per year. This averages out to roughly $100 to $133 per user per month. Telephone numbers for the dialer feature often cost an additional $1 per number per month.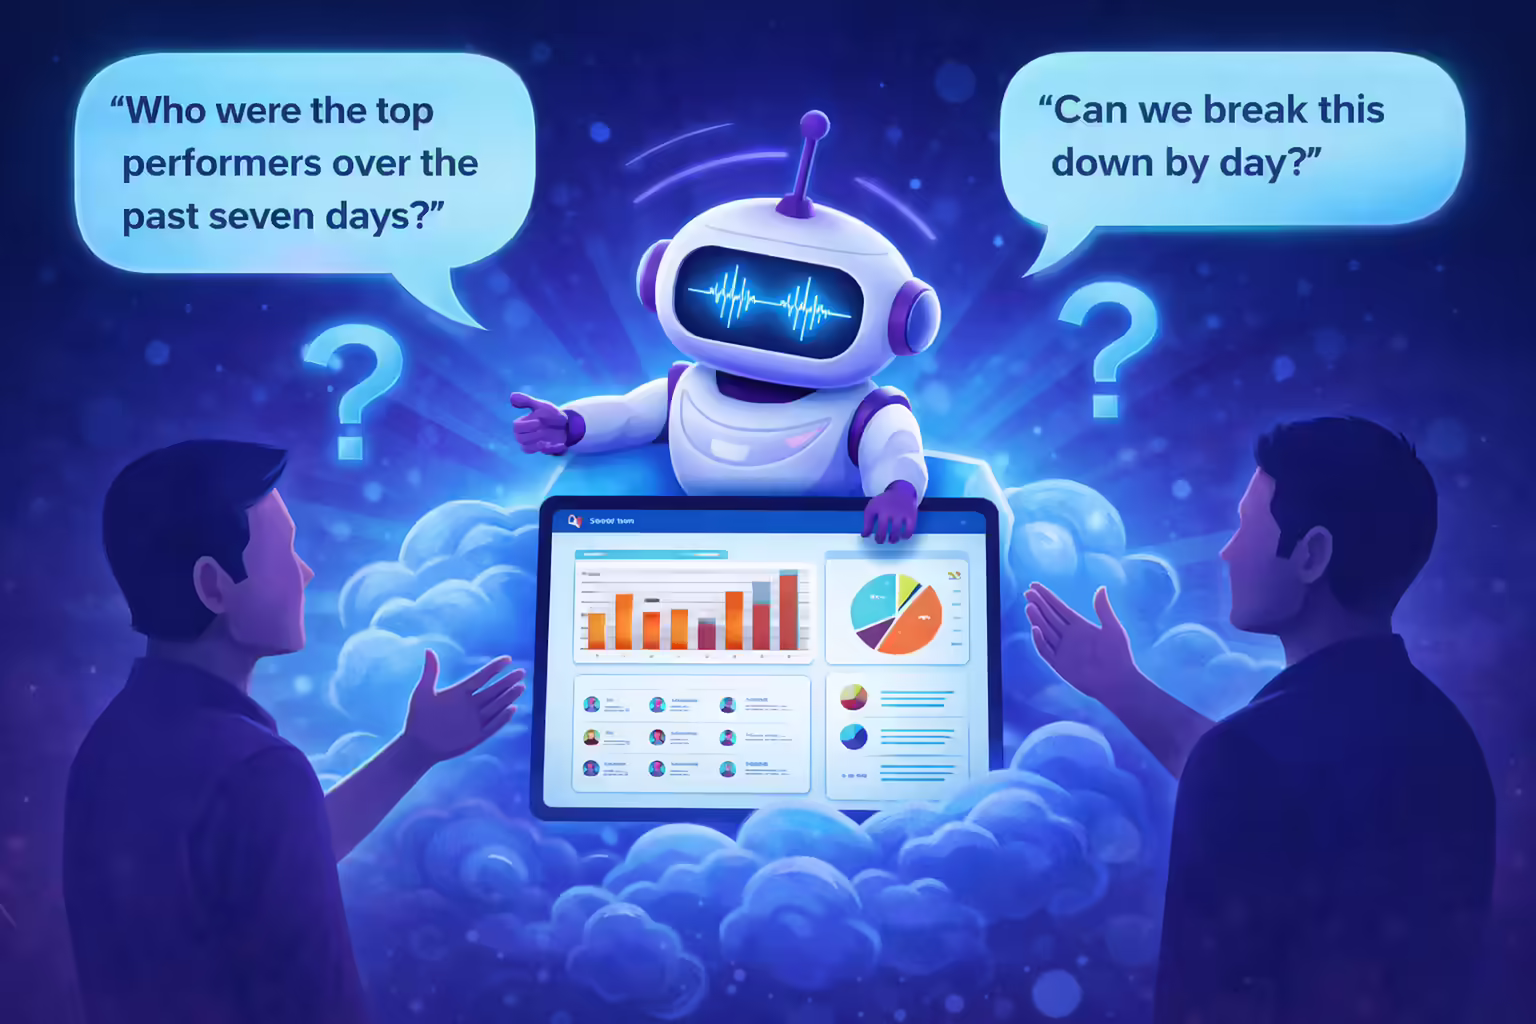
How KAI works as an AI sales dashboard

Build AI sales reports with simple prompts
The core functionality of KAI is its natural language query engine. Instead of manually selecting filters, choosing date ranges, and configuring pivot tables, a manager simply types a question. For example, typing “Who were the top performers over the past seven days?” prompts KAI to analyze the relevant call data, calculate the results, and display them in an organized format almost immediately. KAI also supports follow-up questions within the same session. After receiving the initial results, a manager can refine the query by asking something like “Can we break this down by day?” Each follow-up question causes KAI to recalculate the data and may even trigger a different chart recommendation based on the nature of the new query. If the results include a time-series breakdown, KAI might suggest a line chart. If the results compare individual representatives, it might recommend a bar graph. Once the chart is finalized, the manager can customize the visual output directly in the interface. Options include changing the chart type, adjusting axis formatting, modifying colors, and removing unnecessary groupings. When the report is ready, it can be saved to a new or existing dashboard with a single click. KAI also accepts feedback on its responses. If a result is not quite what the manager expected, they can rate the output, and KAI uses that feedback to improve the accuracy of future queries.Ready made AI sales dashboards and reports
In addition to the open-ended query assistant, Kixie provides pre-built dashboards that are ready to use immediately. Two of the most commonly referenced dashboards are the Connection Summary and the Power Dialer Report. The Connection Summary dashboard helps managers track the quality of outbound conversations over time. A manager can ask KAI what the outgoing connection rate looks like broken down by the last four weeks, and KAI will instantly calculate the number of outgoing calls, the number of connections, and the connection rate for each week. If the connection rate is trending downward, the manager can ask a follow-up and KAI will surface the key patterns and provide a concise summary suitable for sending to a supervisor or sharing in a team meeting. The Power Dialer Report is designed for teams running high-volume outbound campaigns. It tracks dial attempts, connection rates, contacts reached, and the most common methods for removing contacts from power lists. A manager can ask KAI about the most common call outcomes on a specific power list to quickly determine how many prospects connected, how many went to voicemail, and how many had invalid phone numbers. For recurring reporting needs, Kixie supports scheduled reports. Managers can configure any pre-built or custom chart to be automatically sent via email or through a webhook (such as a Slack channel) on a daily, weekly, or monthly cadence.Real AI sales dashboard results
To illustrate the practical impact of KAI, consider the experience of First Connect Insurance, a digital marketplace provider serving independent insurance agents across the United States. First Connect uses Kixie across multiple teams, including outbound sales, onboarding, and inbound agent support. Before adopting KAI, their managers relied on a time-consuming manual process to generate performance reports. They would pull data from business snapshots, filter by date ranges and team members, export the results to Excel, and build pivot tables to get the views they needed. A single analysis that KAI now completes in 15 to 30 seconds previously took 10 to 15 minutes of manual work. The head of sales at First Connect used KAI to build a rapid return on investment analysis for a new branded caller ID service. He asked KAI what percent of outgoing calls exceeded 60 seconds. KAI returned the answer (37.12 percent for the current month) within approximately 10 seconds. He then asked how that compared to previous months. KAI instantly generated a three-month trend showing that the percentage of outgoing calls exceeding 60 seconds had grown from 31.7 percent in October to 33 percent in November to 37.5 percent in December. With just two prompts, he had a complete trend analysis ready to present to his supervisor. On the outbound sales team, a senior manager used KAI for targeted coaching. He asked KAI to compare two representatives who had similar call volumes but significantly different call durations. KAI generated aggregated performance data for each representative, identified a gap of approximately 70 seconds per call, and recommended specific coaching strategies such as asking more open-ended discovery questions and building deeper rapport. On the inbound support side, a team lead used KAI to compare average call times between two agents over a three-month period. KAI identified that one agent averaged 2.73 minutes longer per call than her colleague. The team lead used this insight to coach the agent on efficiency. He also used KAI’s forecasting capabilities to identify the busiest and slowest days of the week, allowing him to schedule internal meetings on lower-volume days so the team could remain fully available during peak call periods.AI sales dashboard access and permissions
KAI is permission-based, which means the level of access depends on the user’s role within the Kixie account. Administrators have full access to view, edit, and create reports and dashboards. Managers can access all data across the team’s reports but cannot edit or create new dashboards. Individual agents can access KAI but are limited to viewing their own personal metrics. This structure ensures that sensitive team-wide performance data is only visible to the appropriate people within the organization.Sales dashboard ROI
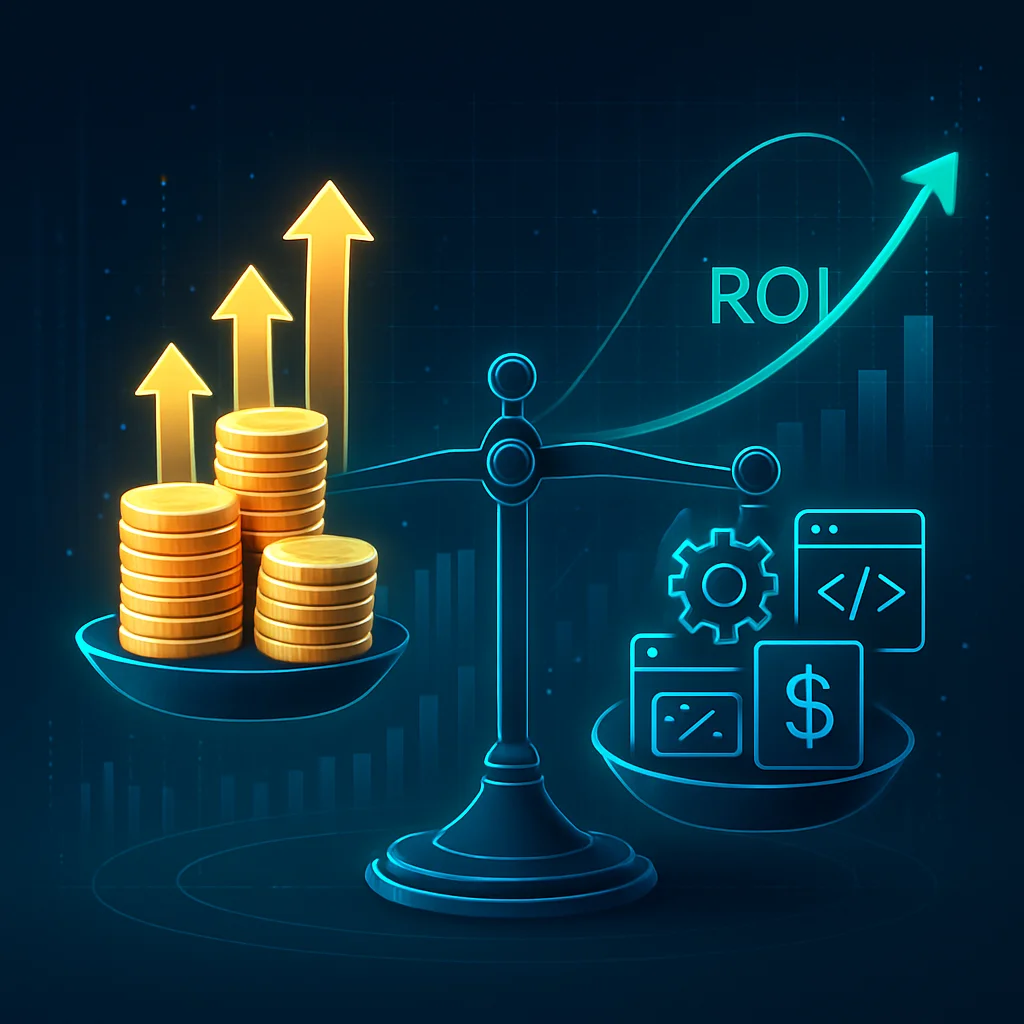
Sales dashboard ROI formula
Return on investment is calculated using a standard financial formula. To find the percentage of return, you take the incremental gross profit created by the software, add any cost savings, subtract the total cost of the artificial intelligence software, and then divide that entire number by the total cost of the software. To get accurate inputs for this formula, you must track both leading indicators and lagging outcomes. Leading indicators show immediate behavioral changes. Examples include speed-to-lead (how fast a representative calls a new prospect) and meeting set rates (how many meetings are booked per 100 calls). Lagging outcomes are the financial results that happen weeks or months later. Examples include the total dollar amount of new pipeline created, the win rate percentage, and the average deal size.Sales dashboard ROI example
To understand how this math works in practice, we can look at a verified case study involving a global financial services firm. This firm deployed an AI sales tool to 800 sales users to reduce the time spent on manual data entry and call logging. The firm measured that the AI dashboard saved each representative an average of 0.77 hours per week. Over the course of 52 weeks, multiplying 0.77 hours by 800 users resulted in 31,968 total hours saved annually. The firm then multiplied those 31,968 hours by the blended hourly cost of their sales representatives. After subtracting the annual cost of the software itself, the firm realized a net annual savings of $4.3 million. Because the savings were so much higher than the software cost, the final return on investment was calculated at 16 times the initial software expense (a 16x ROI).Sales dashboard ROI model
While time-savings calculations are helpful, many revenue leaders prefer a more holistic measurement. Because AI sales tools affect multiple areas of a business, some experts recommend using a Composite ROI Score. This score blends four different categories of value into a single, board-ready metric. The framework weights the score based on business importance:- Revenue Velocity Impact (40 percent weight): This measures changes in the win rate, the average deal size, and the length of the sales cycle. Because this directly impacts cash flow, it carries the heaviest weight.
- Productivity Amplification (30 percent weight): This measures time saved on manual tasks, such as writing follow-up emails or logging call notes into the CRM.
- Strategic Effectiveness (20 percent weight): This tracks how well the team is building relationships and beating competitors. It looks at metrics like multi-threading (talking to multiple people at the same company).
- Organizational Learning (10 percent weight): This measures how quickly new representatives get up to speed during onboarding, and the overall quality of managerial coaching.
Turn saved time into sales revenue
It is important to remember that saving a sales representative’s time only creates financial value if they use that saved time to sell. If an AI dashboard saves a representative 10 hours a month, but they use those 10 hours to browse the internet, the company has not gained any money. This concept is called capacity monetization. A proper ROI model assumes that the saved hours will be repurposed into revenue-generating activities, like making more phone calls. Tools like Kixie’s multi-line power dialer help teams reinvest that saved time by allowing reps to dial multiple prospects simultaneously. If a team of 76 salespeople saves 10.5 hours a month each, that creates 9,576 freed hours per year. By calculating the average revenue generated per hour of selling time, a company can project exactly how much extra income the software will help them produce.AI sales dashboard rollout timeline
Typical sales dashboard deployment timeline
The actual timeline to implement an AI sales dashboard depends entirely on the complexity of your current data and how many software programs need to connect to each other. For basic tools, the timeline is relatively short. Setting up a standard AI chatbot for a website or basic customer service software usually takes between 2 to 4 weeks. Implementing an AI voice agent that can make automated phone calls or answer basic inbound routing questions generally requires 4 to 8 weeks. When moving into actual sales dashboards that require workflow automation, the timeline extends. Connecting the AI software to your email server, your phone system, and your customer relationship management software (like Salesforce) usually takes 6 to 12 weeks.Custom AI models and enterprise sales rollouts
If a business wants to train a custom artificial intelligence model on their own historical sales data, pricing structures, and unique customer behaviors, the project will take significantly longer. Building and testing custom models requires between 12 to 24 weeks. For large, enterprise-level corporations rolling out an AI dashboard to hundreds of employees across different departments, the timeline can span 12 to 18 months from the first pilot program to full, scaled production.Common sales dashboard rollout problems
Research from leading institutions indicates that up to 95 percent of enterprise AI pilot programs fail to deliver a measurable impact on profit and loss. This failure is rarely due to broken technology. Instead, it is caused by poor implementation planning. The most common roadblock is messy data. If a company stores customer phone numbers in spreadsheets, notes in email drafts, and deal sizes in an outdated software platform, the AI dashboard will not work. The AI requires a clean, centralized data source to analyze trends accurately. If the data is scattered, the implementation team must spend weeks or months consolidating the information before the dashboard can even be turned on. Another major delay involves staff training and optimization. After the software is launched, it typically requires another 2 to 4 weeks of optimization. The AI system needs time to analyze real-world usage patterns and learn the specific vocabulary of your industry. Managers must plan for this learning curve rather than expecting perfect results on the first day.AI sales dashboard compliance and call recording risks

Sales call consent rules
In the United States, call recording consent laws are divided into two distinct categories: one-party consent and two-party consent. In a one-party consent jurisdiction, only one person on the phone call needs to know that the call is being recorded. Because the sales representative making the call is aware of the recording, the call can be legally recorded without explicitly asking the buyer for permission. States like New York and Texas operate under one-party consent laws. However, 11 states operate under two-party consent laws (also known as all-party consent). These states include California, Connecticut, Florida, Illinois, Maryland, Massachusetts, Montana, Nevada, New Hampshire, Pennsylvania, and Washington. In these jurisdictions, every person on the phone call must agree to the recording before it begins. If a sales representative calls a prospect in California, the representative must clearly state that the call may be recorded for quality and training purposes within the first few seconds of the conversation. If the prospect continues to talk after hearing this disclosure, their continuation establishes implied consent. If the representative forgets to read the disclosure, the company is breaking the law. In states like California, violations can lead to fines of up to $5,000 per call. Furthermore, plaintiffs’ attorneys are beginning to target businesses that use third-party AI software to analyze these calls. Under laws like the California Invasion of Privacy Act, some lawsuits argue that sending customer voice recordings to an external AI vendor without the customer’s permission constitutes illegal wiretapping or eavesdropping.Sales call TCPA rules
Outbound sales teams must also comply with the Telephone Consumer Protection Act. This federal law governs the use of automatic telephone dialing systems and artificial voices. In February 2024, the Federal Communications Commission issued a ruling that directly impacts AI sales tools. The commission clarified that any phone call utilizing an AI-generated voice is considered an artificial voice call under the Telephone Consumer Protection Act. Therefore, making an AI-generated cold call to a consumer without obtaining their prior express written consent is strictly prohibited. Sales managers experimenting with AI voice bots that speak to prospects autonomously must ensure they only call individuals who have previously opted into receiving such communications. Furthermore, AI calling systems must be programmed to regularly scrub their call lists against the National Do Not Call Registry.Sales dashboard GDPR requirements
For businesses calling prospects in Europe, the legal requirements are even stricter. The General Data Protection Regulation (GDPR) treats any voice recording that can identify an individual as the processing of personal data. This applies even if the recording is only buffered temporarily for AI transcription and then deleted. Under the GDPR, companies must have a valid, lawful basis to record the call. The caller must be clearly informed of who is recording the call, why it is being recorded, and how long the data will be kept. Furthermore, European residents have the legal right to request access to their call recordings, ask for corrections, or demand that the recordings be permanently deleted from the company’s servers. AI dashboards used in these regions must have features that allow administrators to easily locate and erase specific call transcripts to comply with these consumer requests.AI sales dashboard FAQs

What is an AI sales dashboard?
An AI sales dashboard is a digital interface that connects to a company’s phone system, email platform, and customer database. It uses artificial intelligence to automatically transcribe phone calls, analyze buyer sentiment, track key metrics like talk-to-listen ratios, and visually display this data to help managers forecast revenue and coach sales representatives.How much does an AI sales dashboard cost?
Costs vary drastically depending on the provider and the size of your team. Basic dialers with unified communications, like Dialpad, can start between $15 and $25 per user per month. Comprehensive revenue orchestration platforms, like Salesloft, average between $100 and $133 per user per month. Premium enterprise tools, like Gong, can cost $1,600 per user annually, plus a base platform fee of $50,000 per year.What is a good talk to listen ratio for sales calls?
Based on artificial intelligence analysis of over 25,000 business-to-business sales calls, the ideal ratio is 43 to 57. This means the sales representative should talk for roughly 43 percent of the conversation and encourage the potential buyer to talk for 57 percent of the time.Are AI voice agents and call recorders legal?
Yes, but they are strictly regulated. In the United States, recording calls requires adherence to state-specific consent laws. Eleven states require all parties on the line to consent to being recorded. Additionally, the Federal Communications Commission requires businesses to obtain prior express consent before making any outbound cold calls using an AI-generated artificial voice.How long does sales dashboard software take to implement?
It takes most businesses 6 to 12 weeks to properly implement a sales dashboard with full workflow automation connected to their existing databases. Highly complex, custom artificial intelligence models can take 12 to 24 weeks to build, test, and deploy.Use these quick answers to clarify what an AI sales dashboard is, which metrics matter most, how AI differs from traditional sales reporting, and what to consider before rollout.
AI sales dashboard key takeaways

Ready to close more deals with Kixie?
See how Kixie's AI-powered tools can transform your sales and support operations.
Start Free Trial