TL;DR: Kixie AI Insights lets RevOps teams query call, SMS, call outcome, connection rate, agent performance, and PowerList data in plain English through Kai, Kixie’s AI report builder. The seven sample prompts in this post cover trend detection, breakdowns by agent or time, coaching analysis, week-by-week outgoing connection rates, call histograms, today-vs-yesterday KPI comparisons, and day-by-hour heat maps. Each prompt is aimed at faster staffing, coaching, forecasting, and outbound planning without exporting CSVs, building SQL queries, or waiting on a BI resource.
RevOps leaders are drowning in raw data but starved for usable insight. Teams generate thousands of calls, SMS messages, and dispositions inside Kixie every day, but turning that activity into answers often means exporting CSVs, wrangling spreadsheets, or waiting on a BI resource.
Kixie’s AI Insights section changes that dynamic. It lets teams build reports from Kixie data such as calls, SMS, call outcomes, connection rates, agent performance, and PowerList activity without using SQL or a dashboard builder.
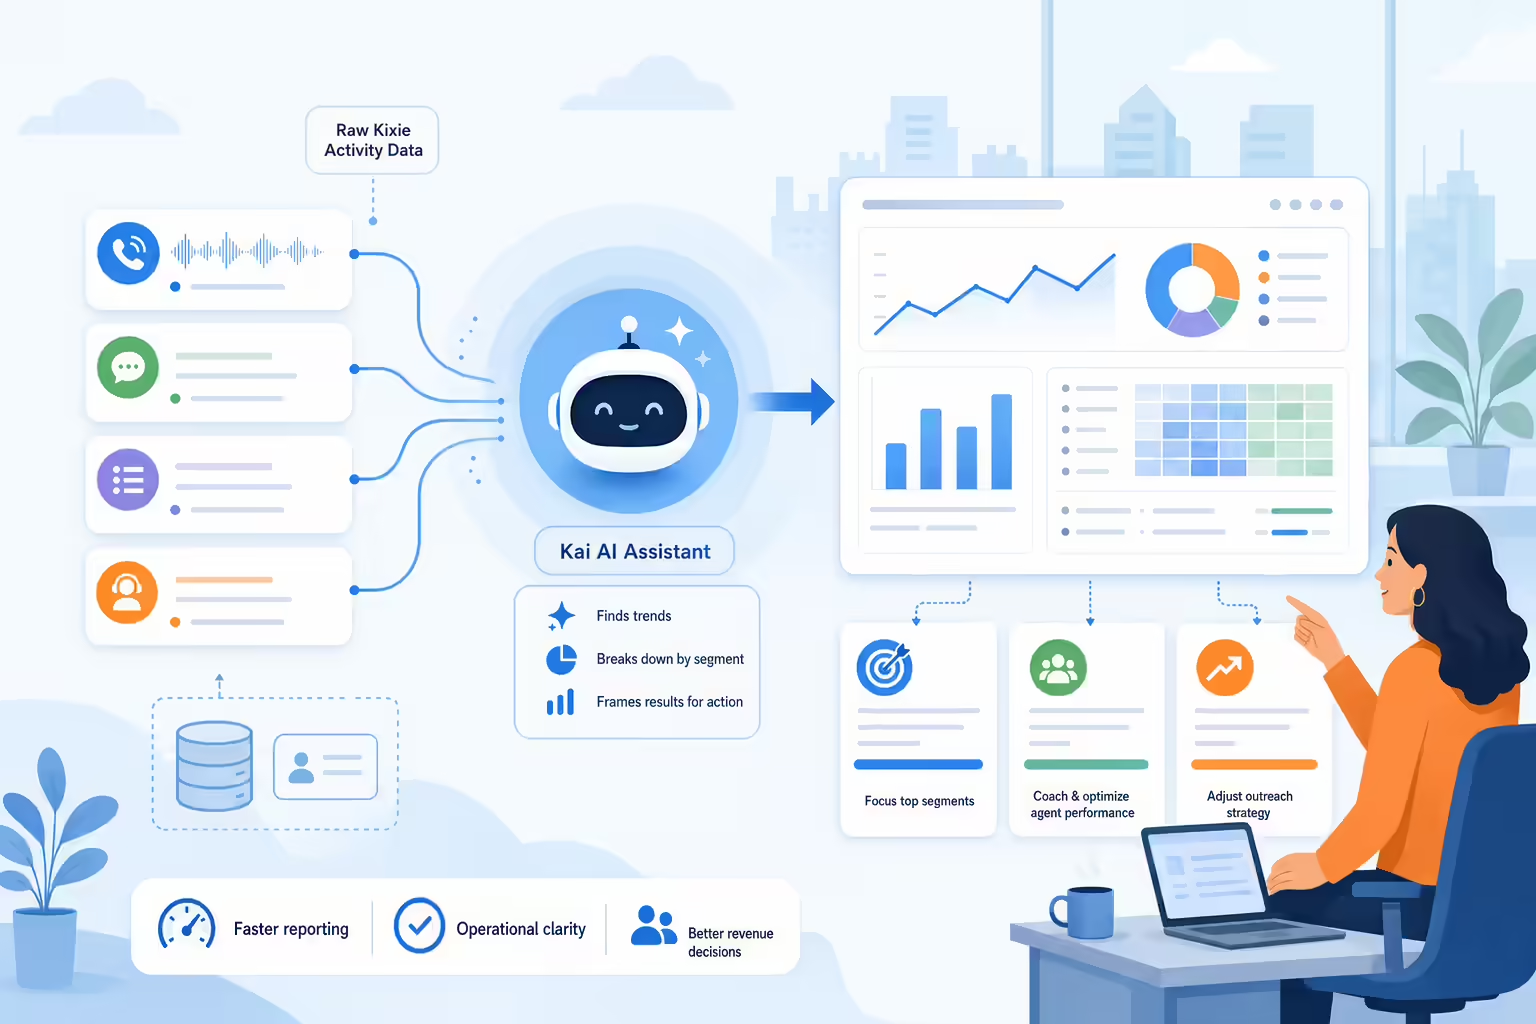
Sitting on top of AI Insights is Kai, Kixie’s AI report builder. Instead of building reports manually, users describe what they want in plain English and Kai handles the charting, filtering, and trend summaries.
Below are seven prompt examples that show how RevOps leaders can use AI Insights and Kai to get immediate answers from their Kixie data.
How Kai Helps RevOps Teams
Kai helps teams move from raw activity data to usable reporting without relying on spreadsheet exports or custom BI work. It can surface trends, break performance down by segment, and frame the results in a way that supports day-to-day decisions.
Kai Prompt 1 for Trend Analysis
Prompt: Show me any trends in the data that I should need to be aware of.
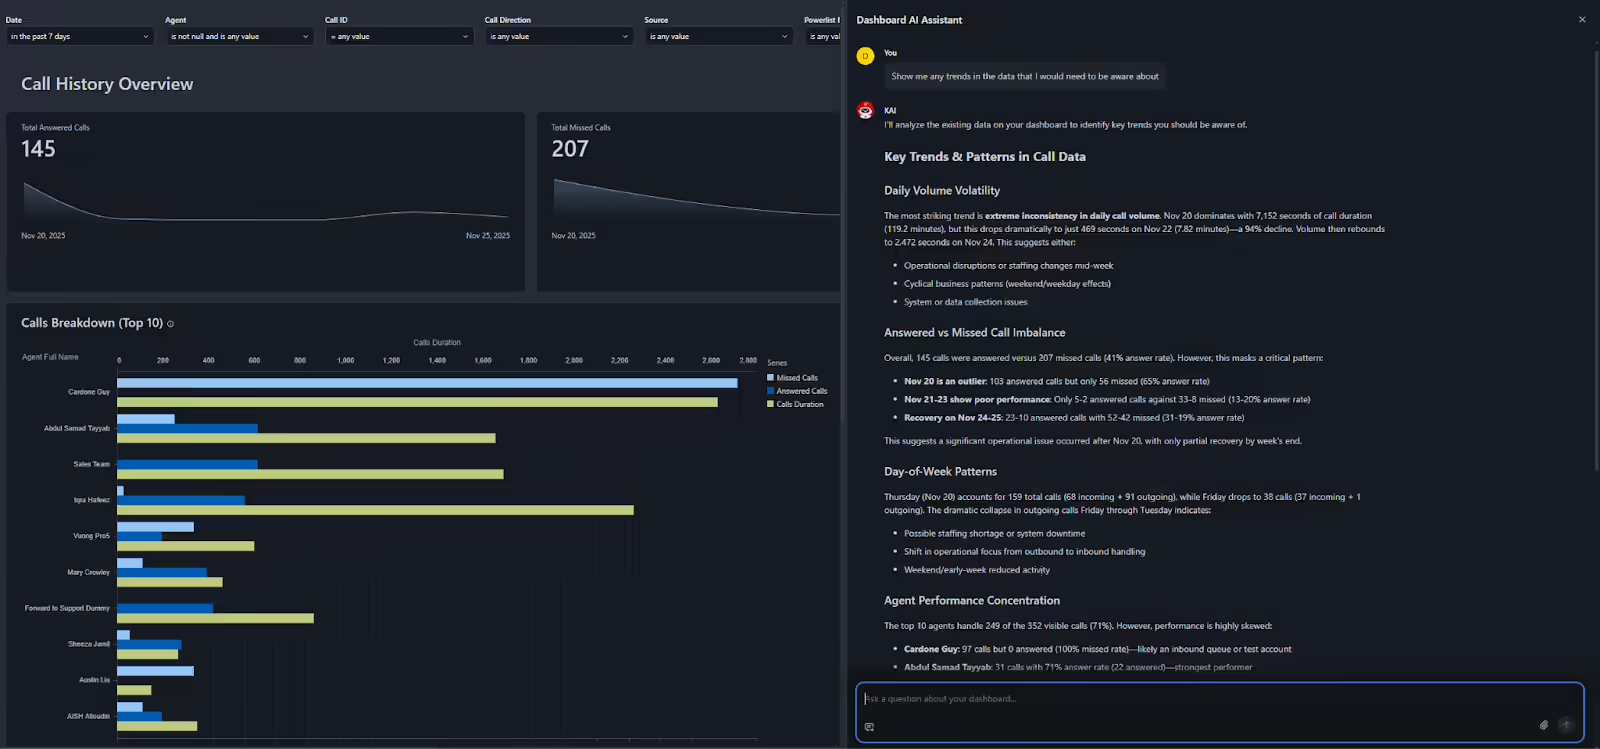
This is the most RevOps-native prompt in the set because it asks what the data is signaling rather than requesting one narrow metric. Kai scans call history, answered versus missed calls, duration, and agent performance to surface high-level patterns.
Why This Kai Prompt Matters
- Highlights daily volume swings, such as a sharp Tuesday drop versus Monday.
- Shows answered versus missed call imbalances by team.
- Flags volume concentration when a small number of reps handle most activity.
Kai Prompt 2 for Data Breakdowns
Prompt: Break the data down by x y z, such as agents, day of week, or time of day.
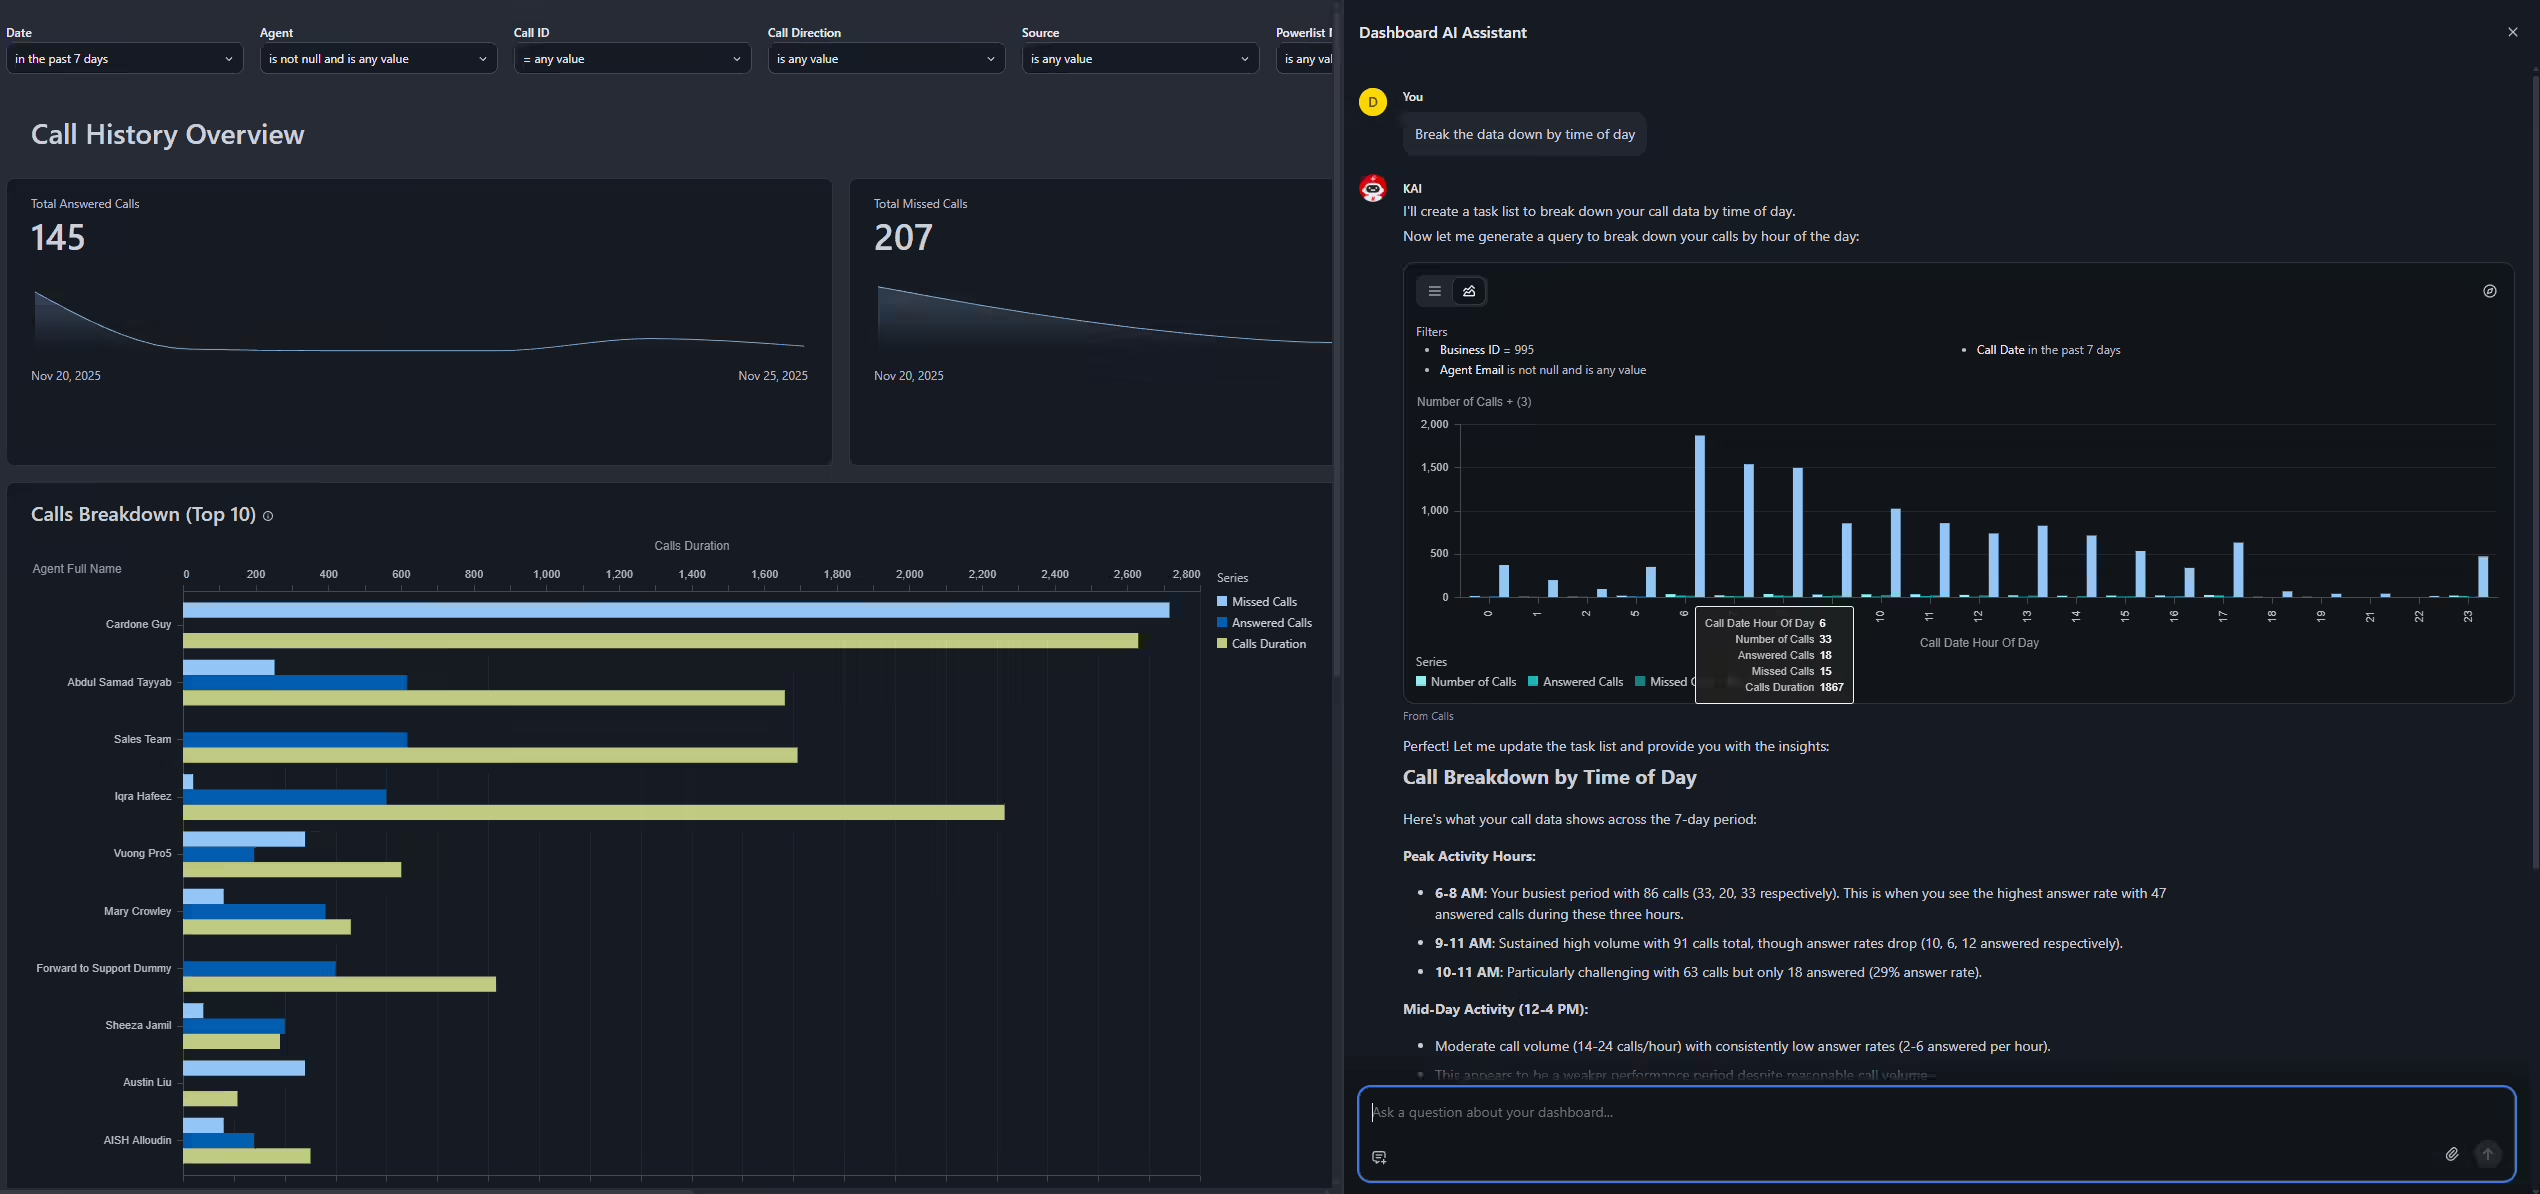
Once the big trends are clear, the next step is to segment the data. AI Insights can break performance down by agent, team, time of day, day of week, PowerList, call direction, and more.
Kai responds with charts that show call volume, answered calls, missed calls, and total call duration for each segment.
Why This Kai Prompt Matters
- Shows which hours drive the most demand.
- Reveals whether outbound activity lines up with customer behavior.
- Exposes hours with heavy missed-call volume.
Kai Prompt 3 for Coaching Opportunities
Prompt: Based on the call history, are there any coaching opportunities?
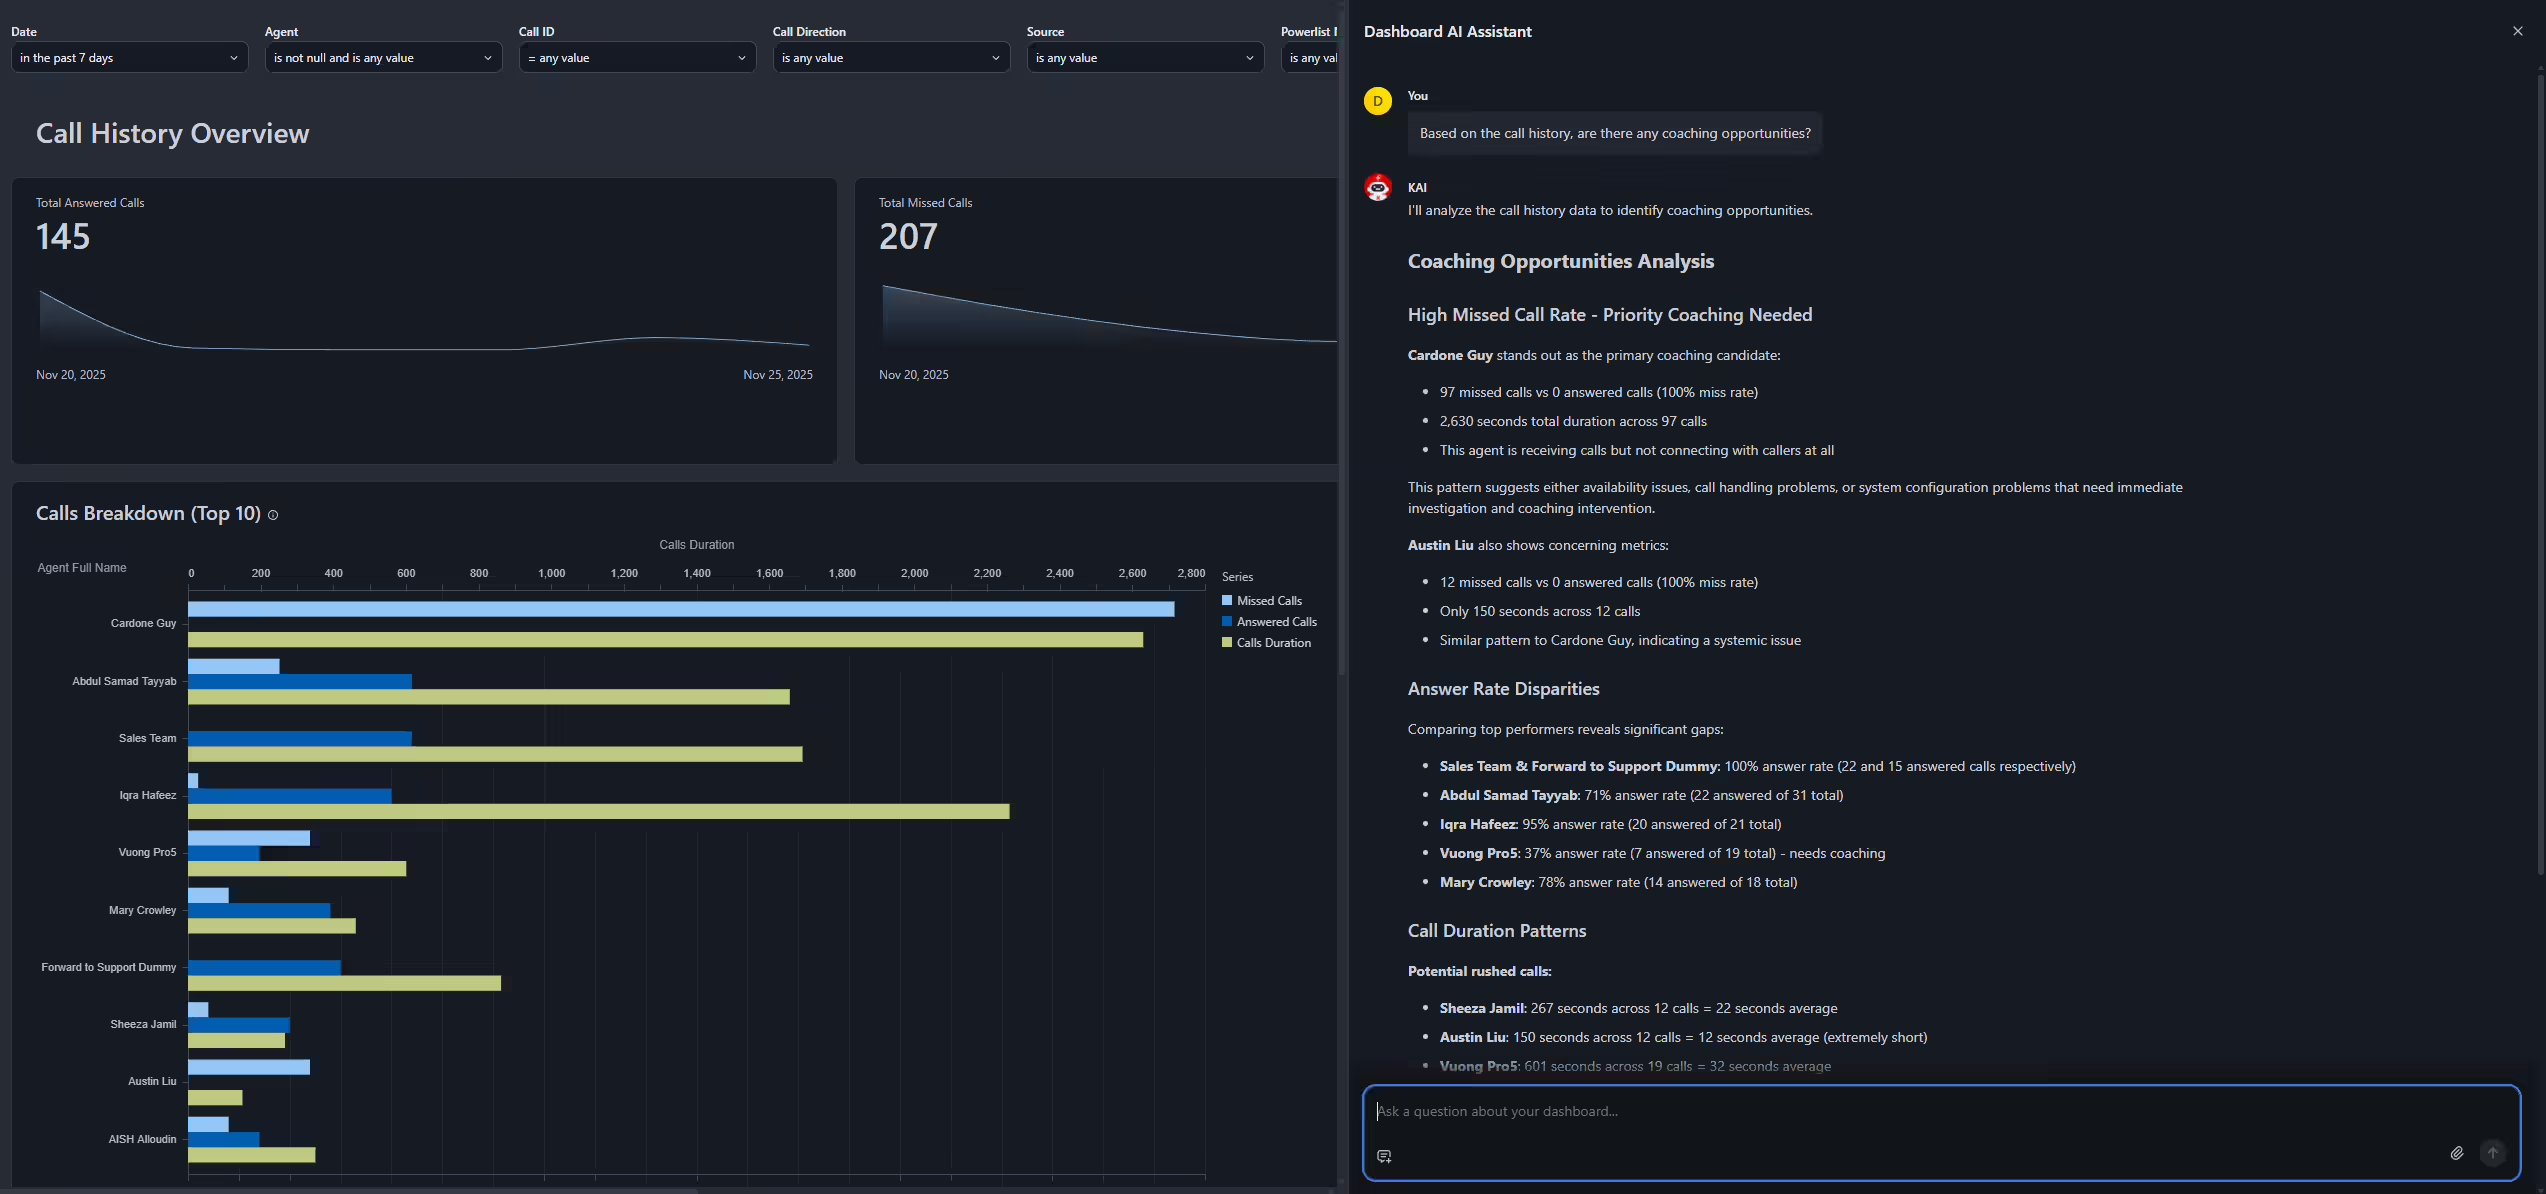
This prompt turns call history into a coaching radar. Kai can analyze missed versus answered calls per agent, average talk time, and connection rates to surface specific issues that need attention.
Why This Kai Prompt Matters
- Spots agents with very high missed-call counts and no answered calls, which can indicate availability issues.
- Finds reps with unusually short average call duration, which can suggest poor qualification.
- Supports objective, data-backed performance conversations.
Kai Prompt 4 for Connection Rate Trends
Prompt: What is the outgoing connection rate breakdown week by week?
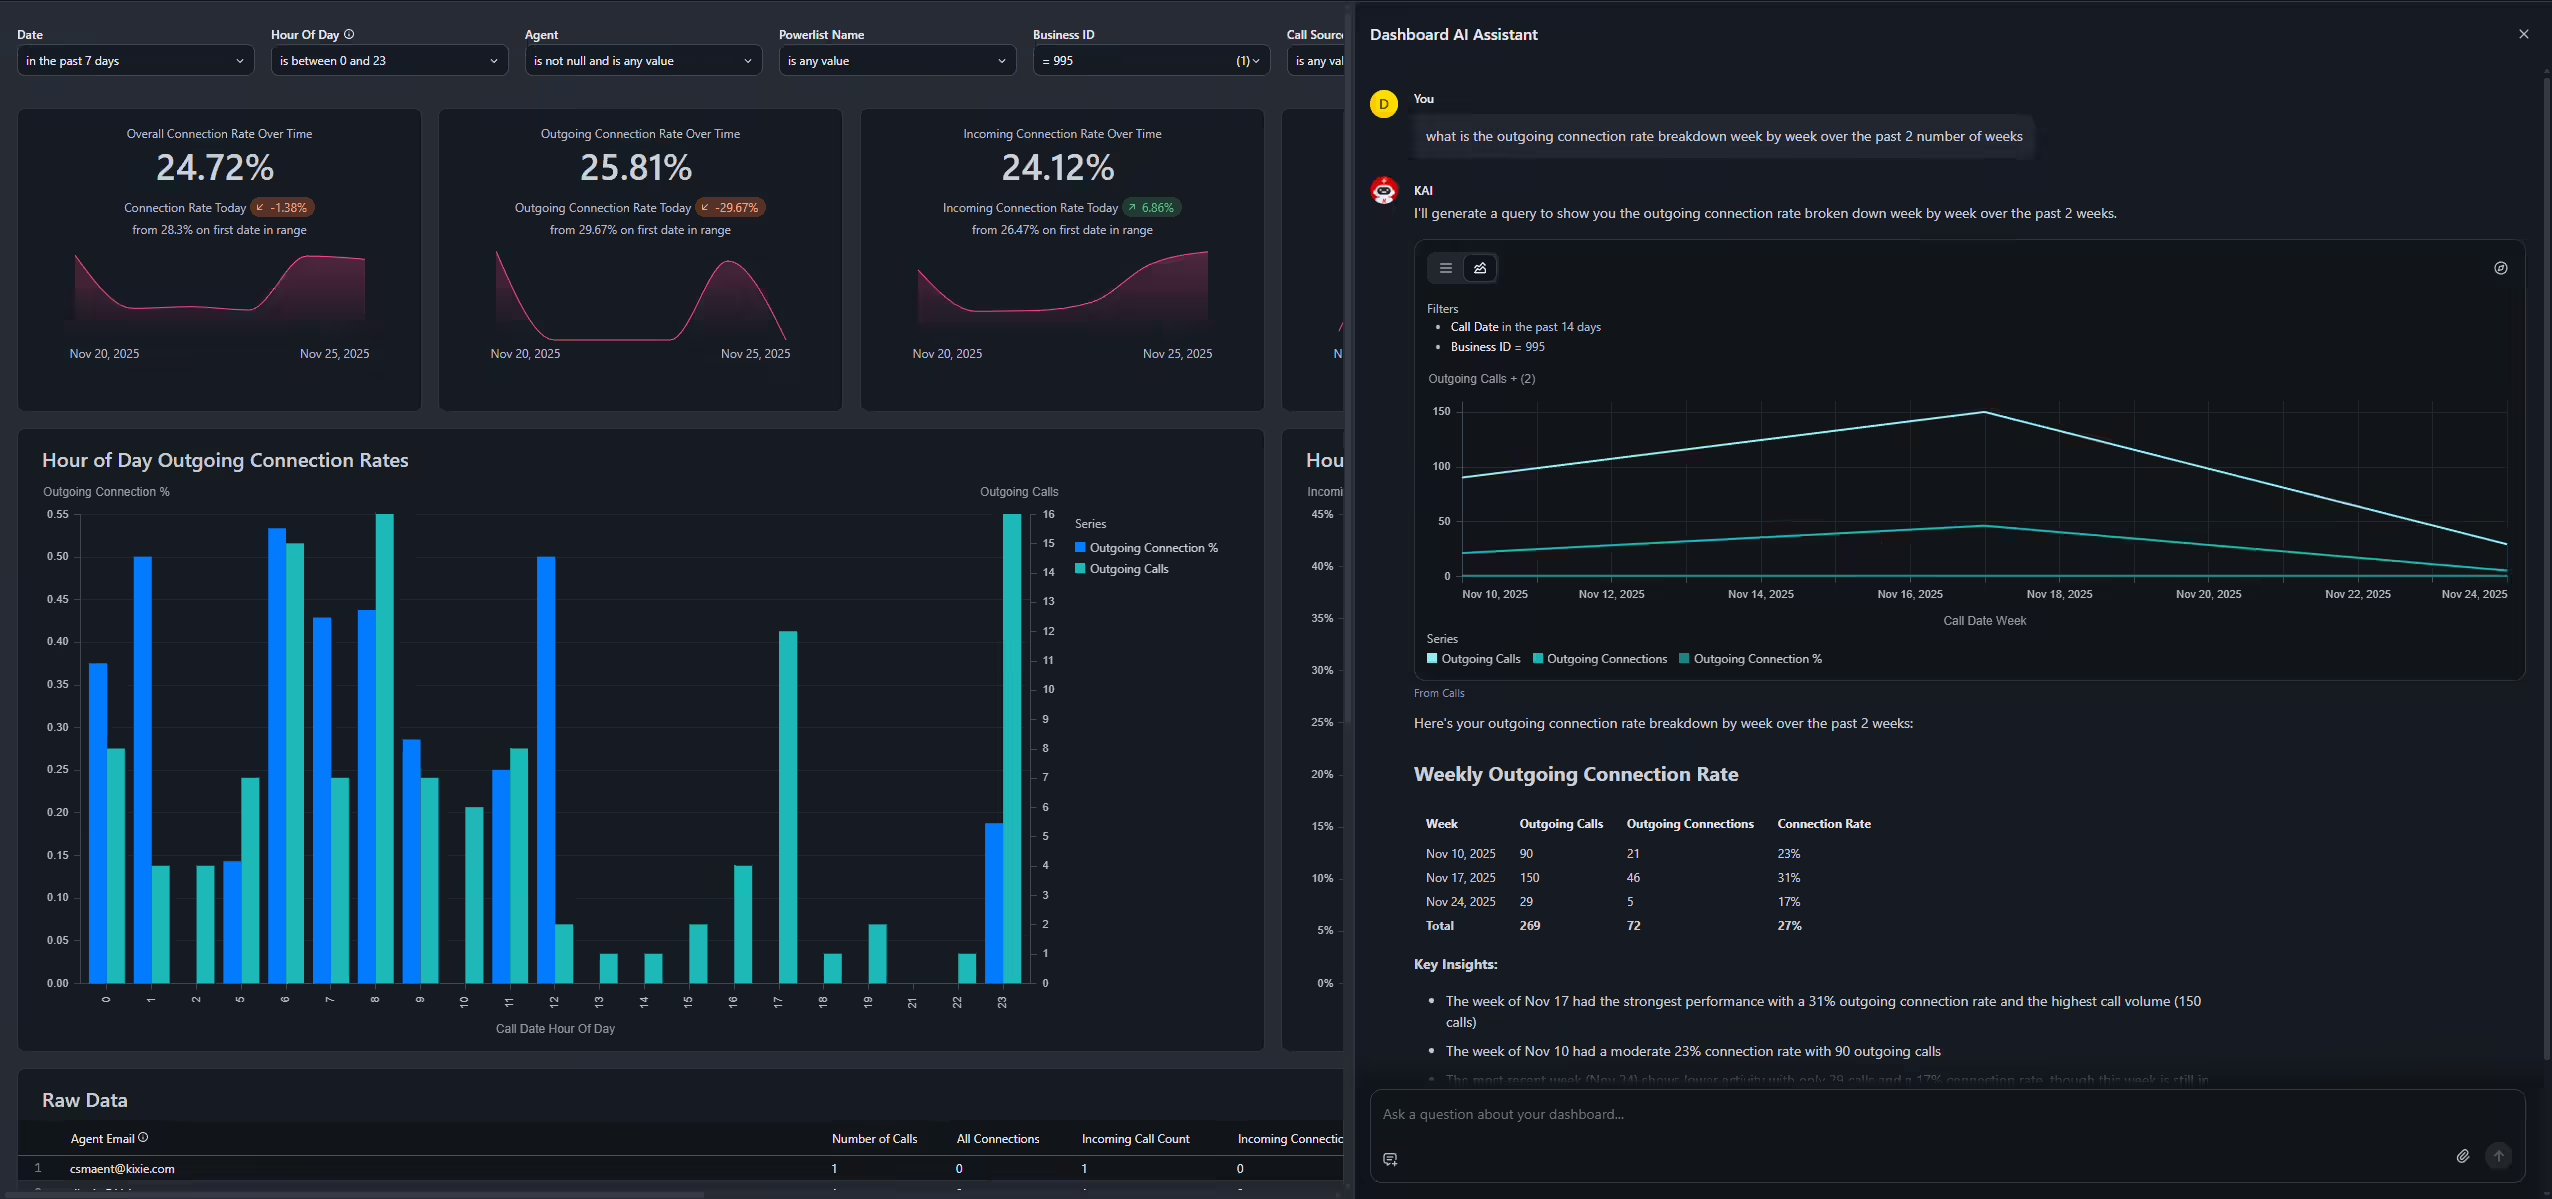
Connection rate is one of the most important outbound performance metrics. This prompt asks Kai to show how outgoing connection rate changes week by week over a given period.
Why This Kai Prompt Matters
- Connects operational changes such as scripts, lists, and cadences to weekly outcomes.
- Exposes negative trends before they become entrenched.
- Supports forecasting and planning with conversion data.
Kai Prompt 5 for Call Histograms
Prompt: Give me a histogram of calls per hour of day.
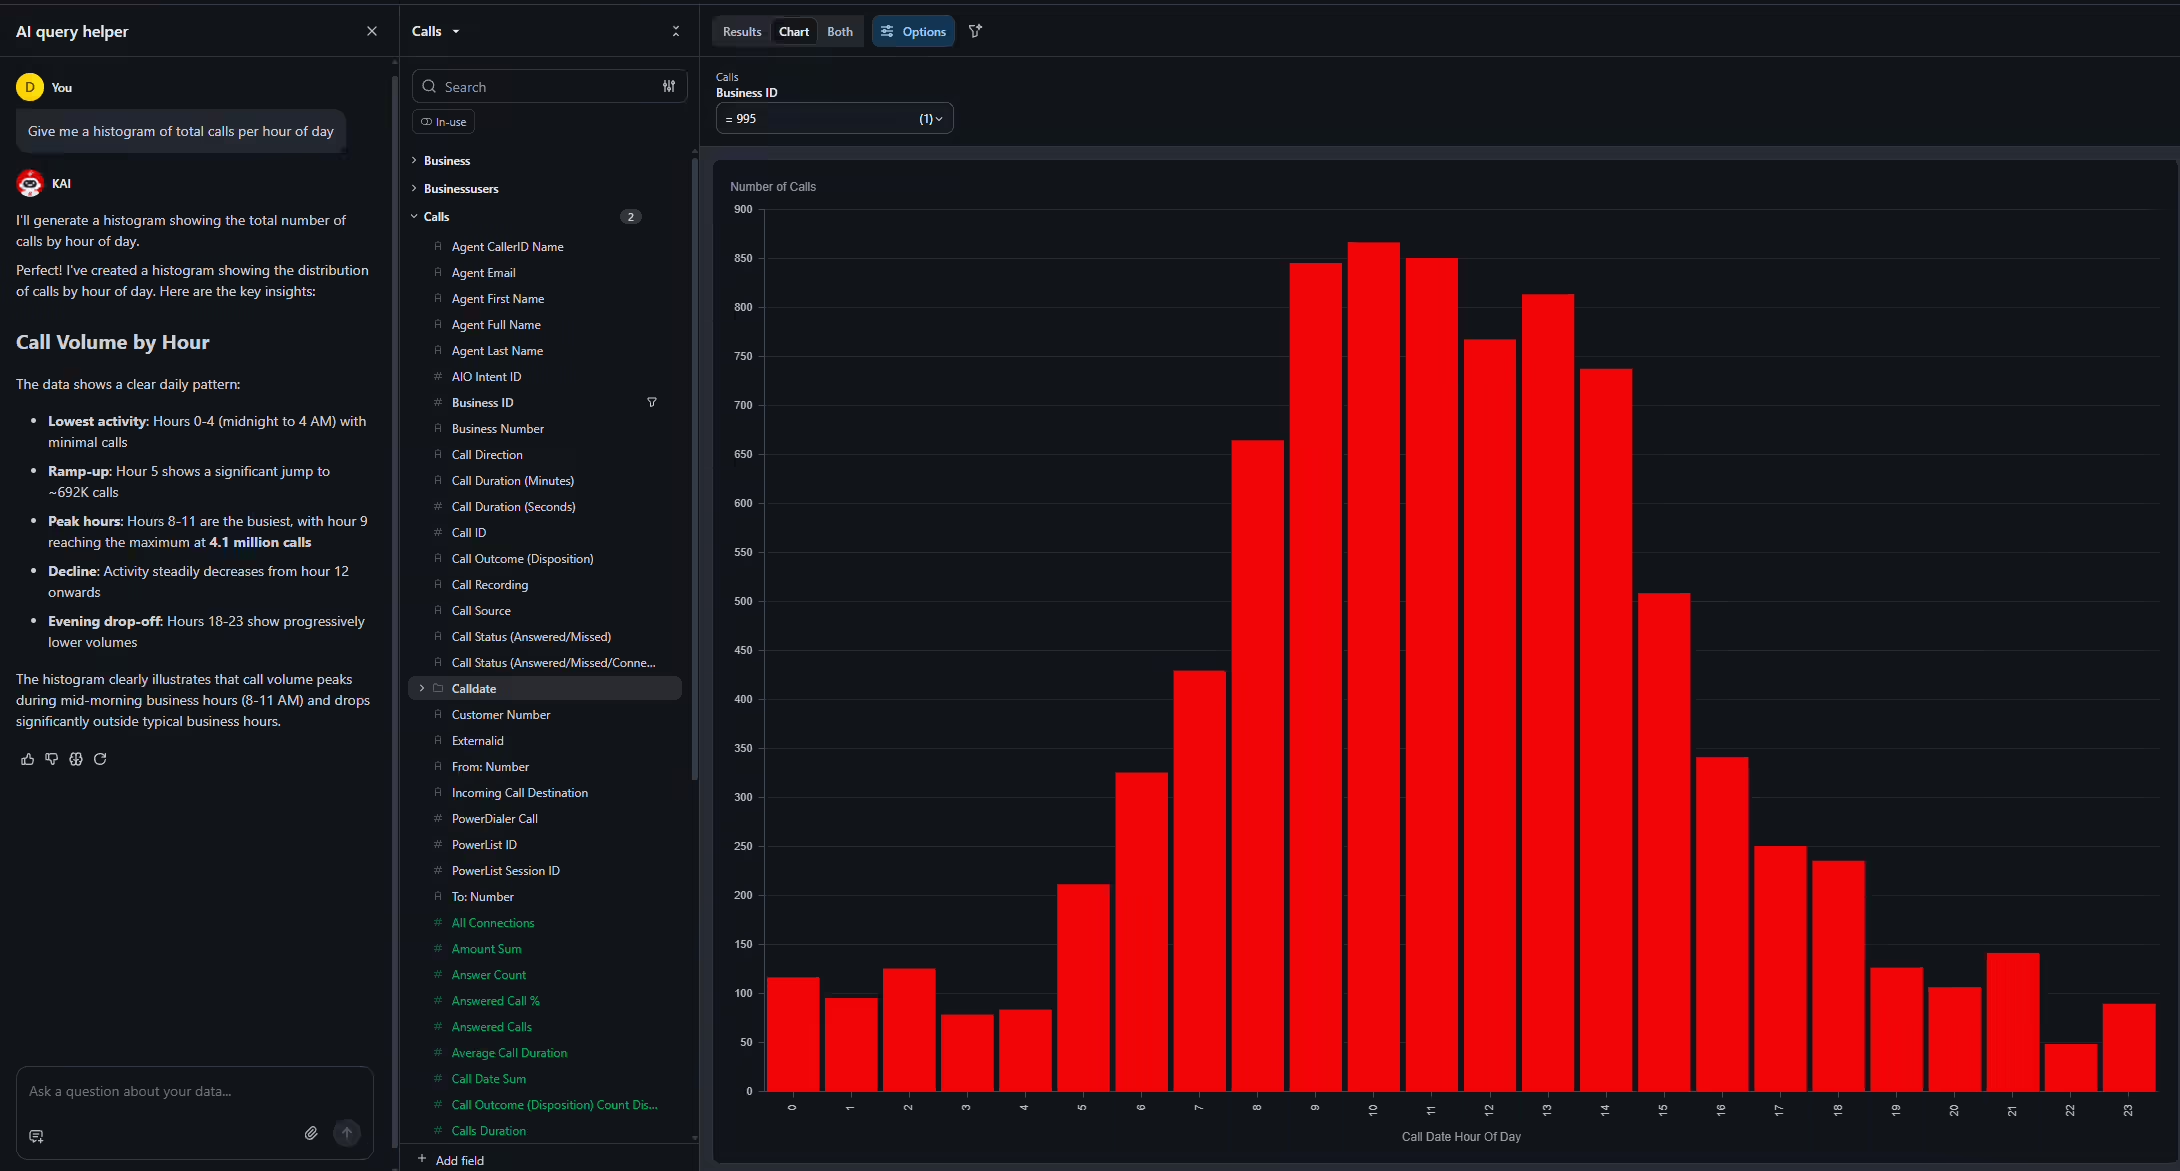
This histogram prompt is built for visualizing distribution. Kai returns a bar chart where each bar represents the number of calls in a given hour, agent grouping, or list segment.
Why This Kai Prompt Matters
- Identifies peak hours such as 9 to 11 AM versus slower periods.
- Compares actual volume patterns to staffing and shift coverage.
- Helps teams decide when to run PowerLists or campaigns.
Kai Prompt 6 for Daily KPI Comparisons
Prompt: Give me a KPI graph that shows the connection rate of today compared to yesterday.
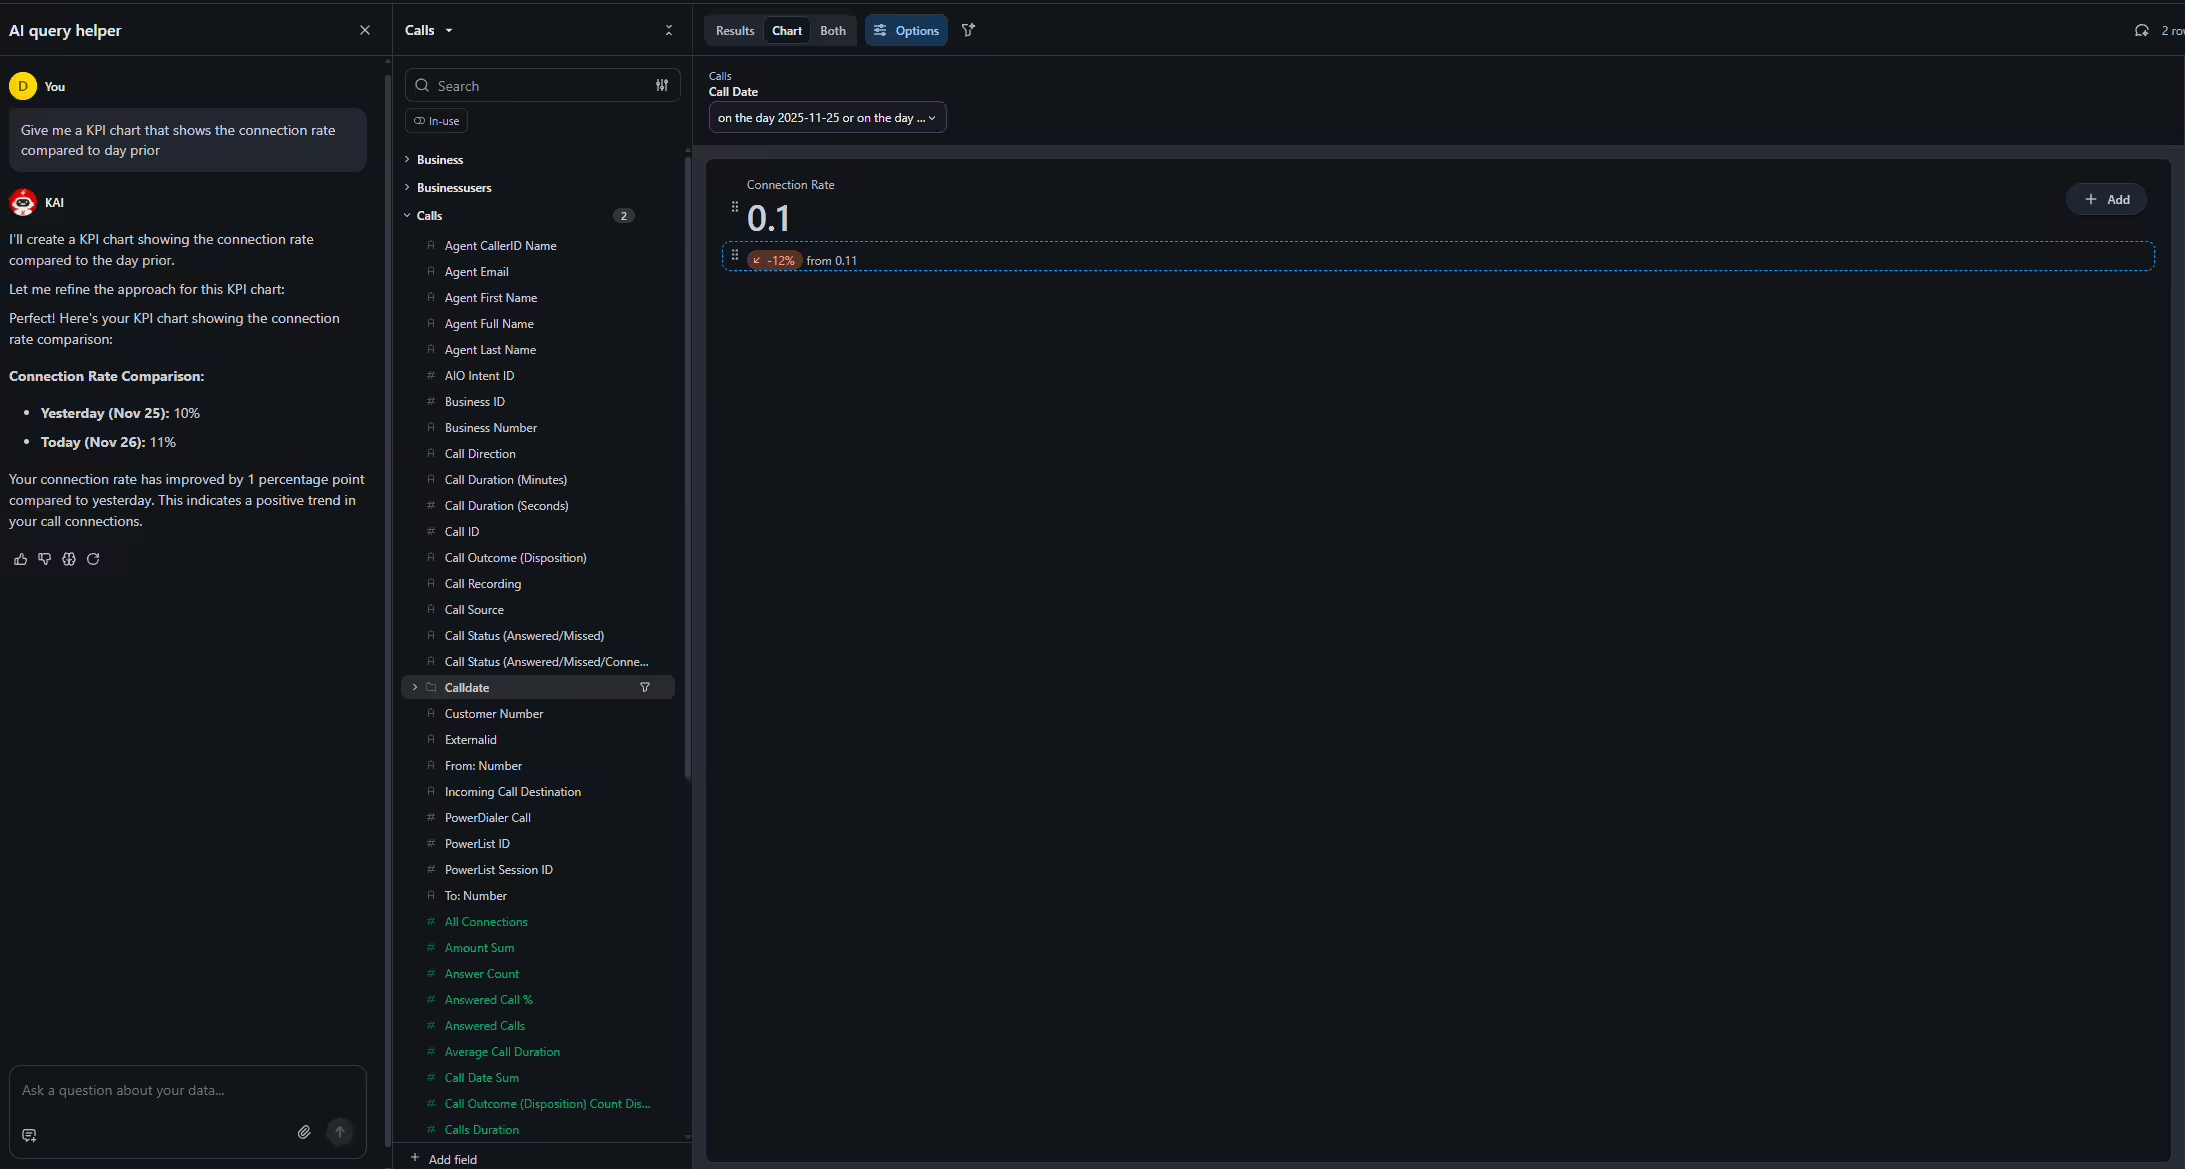
Sometimes teams need a quick health check. This prompt asks Kai to calculate the delta between two periods and present it as a KPI-style graph with a short explanation of what the change implies.
Why This Kai Prompt Matters
- Validates whether a new list, script, or schedule change is working.
- Catches sudden drops that may indicate system issues or list fatigue.
- Gives leadership a simple metric they can understand quickly.
Kai Prompt 7 for Connection Rate Heat Maps
Prompt: Give me a heat map of highest connection rate with day of week on the y-axis and hour of day on the x-axis.
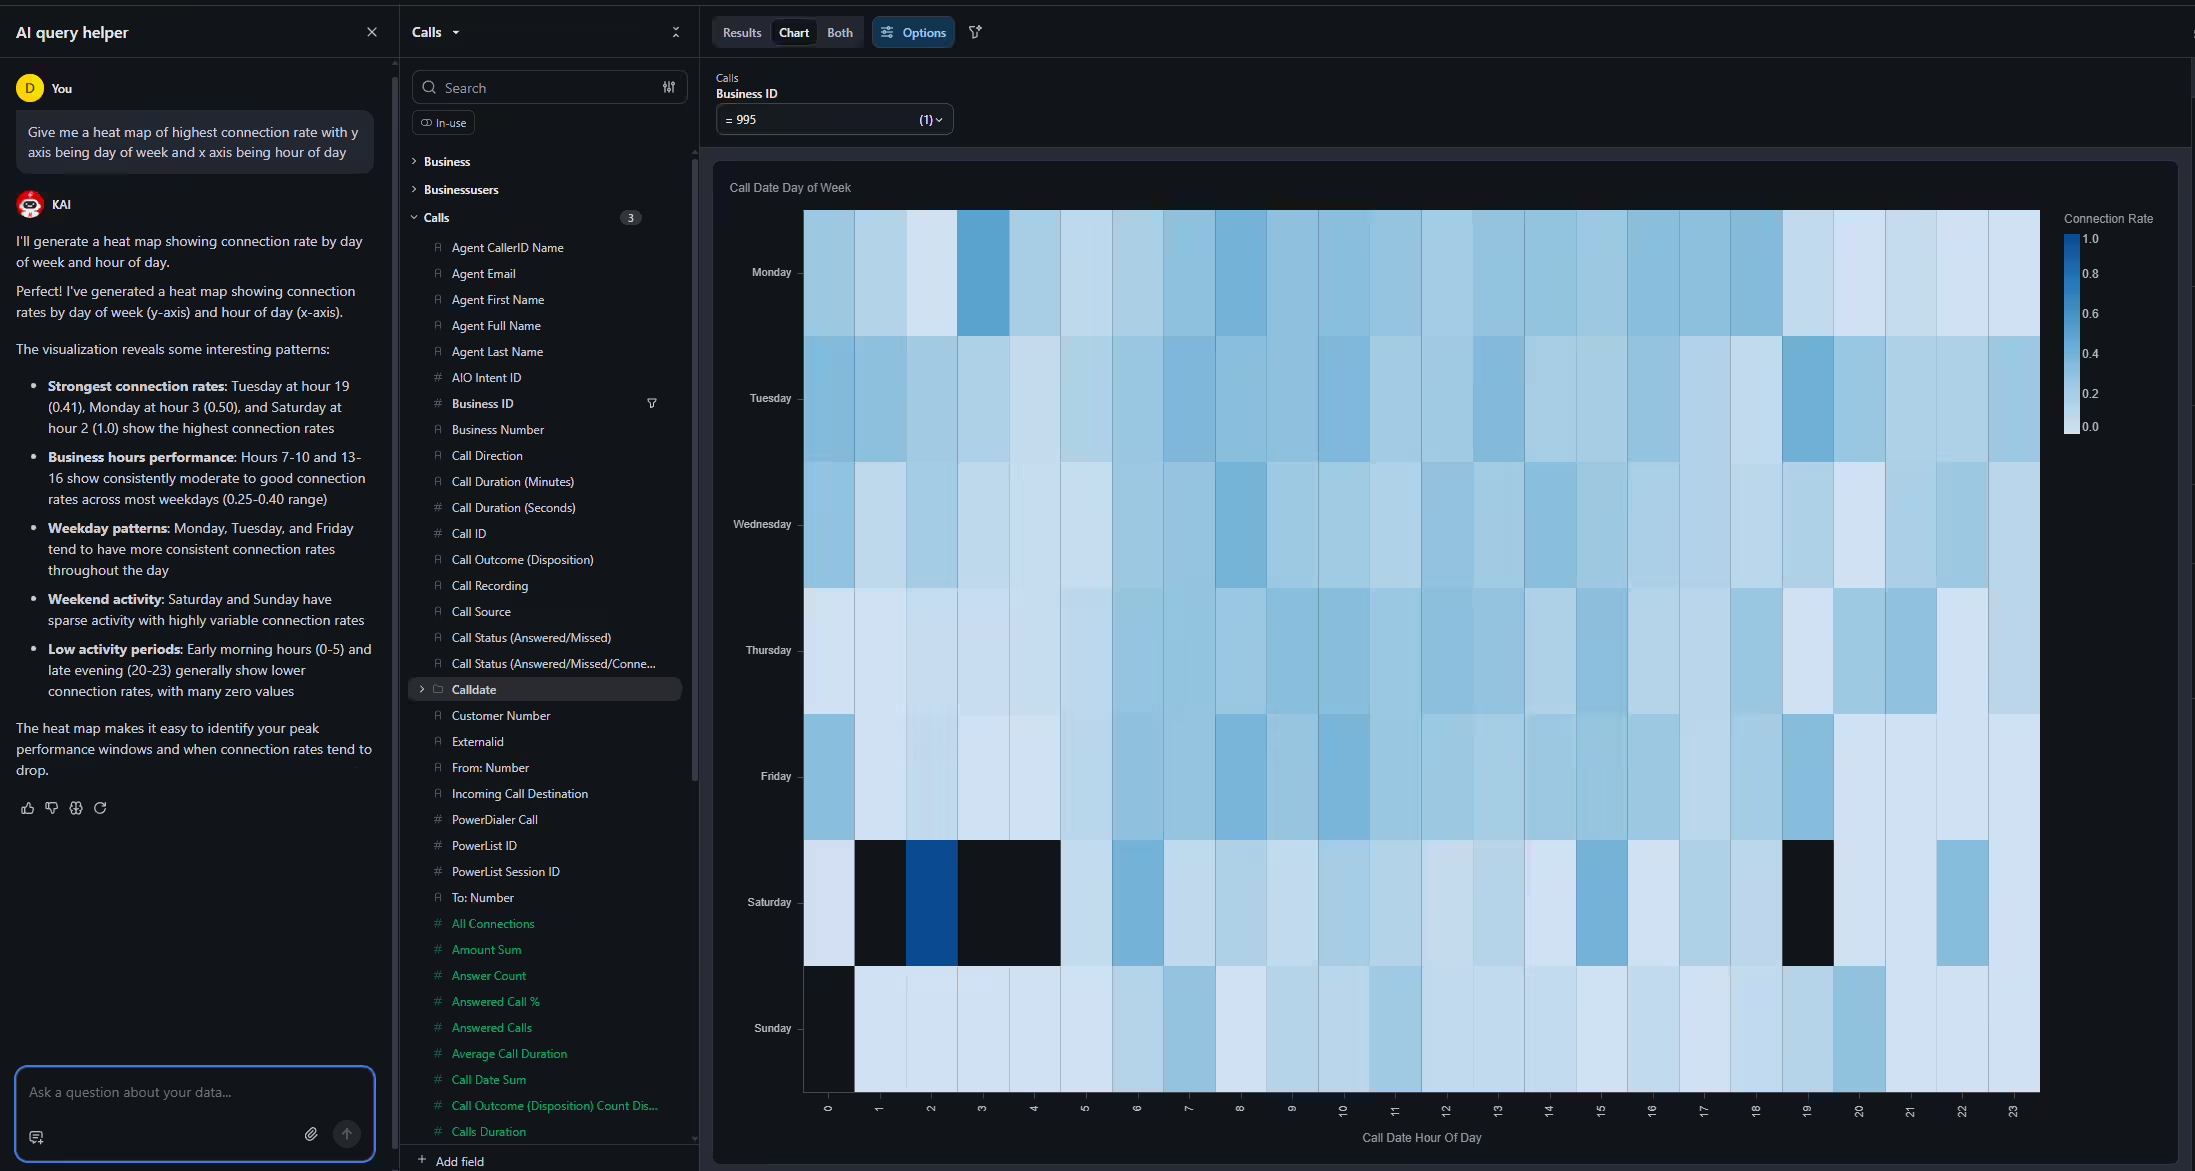
This is the most advanced visualization in the set. The heat map uses color intensity to show connection success across days of the week and hours of the day.
Why This Kai Prompt Matters
- Shows the exact day-and-hour combinations where connection rates spike.
- Highlights low-yield windows where callers rarely connect.
- Shows differences between weekdays and weekends.
Why AI Insights Matters for RevOps

Across all seven prompts, the story is the same: AI Insights and Kai turn Kixie activity data into an always-available RevOps analyst.
- Build reports on demand. If the data exists in Kixie, Kai can surface it in tables, histograms, heat maps, or trend charts.
- Focus on the question, not the mechanics. Kai handles the query building and charting.
- Move from reactive to proactive. Teams can ask for trends daily and act sooner.
- Scale insight without headcount. Stakeholders can self-serve views without leaning on analytics resources for every answer.
- Make better decisions. Staffing, list allocation, and coaching can stay grounded in live data instead of gut feel.
AI Insights and Kai do not just make reporting easier. They help revenue teams make faster, better-informed decisions.
Ready to close more deals with Kixie?
See how Kixie's AI-powered tools can transform your sales and support operations.
Start Free Trial