Introducing Kixie AI Insights — A New AI-Powered Reporting & Analytics Experience

Kixie AI Insights

Turn Calling & SMS Data into Revenue Signals

Sales and operations teams run on conversations — but most call and text data sits dormant in logs and spreadsheets. Kixie AI Insights makes company communications a first-class source of truth by delivering real answers that you can act on immediately.

Try Kixie Free

TRUSTED BY 5000+ REVENUE TEAMS WORLDWIDE

  • Gosite Logo
  • Lexington Capital Holdings logo
  • Jordan Belfort Logo
  • Pagehub Logo
  • Pipedrive Logo
  • Ruoff Mortgage Logo
  • AmeriSave Logo
  • Asmodee Logo
  • Canopy Logo
  • Clean.Tech Logo
  • Grant Cardone Logo

Pre-Built Dashboards & Reports Hub

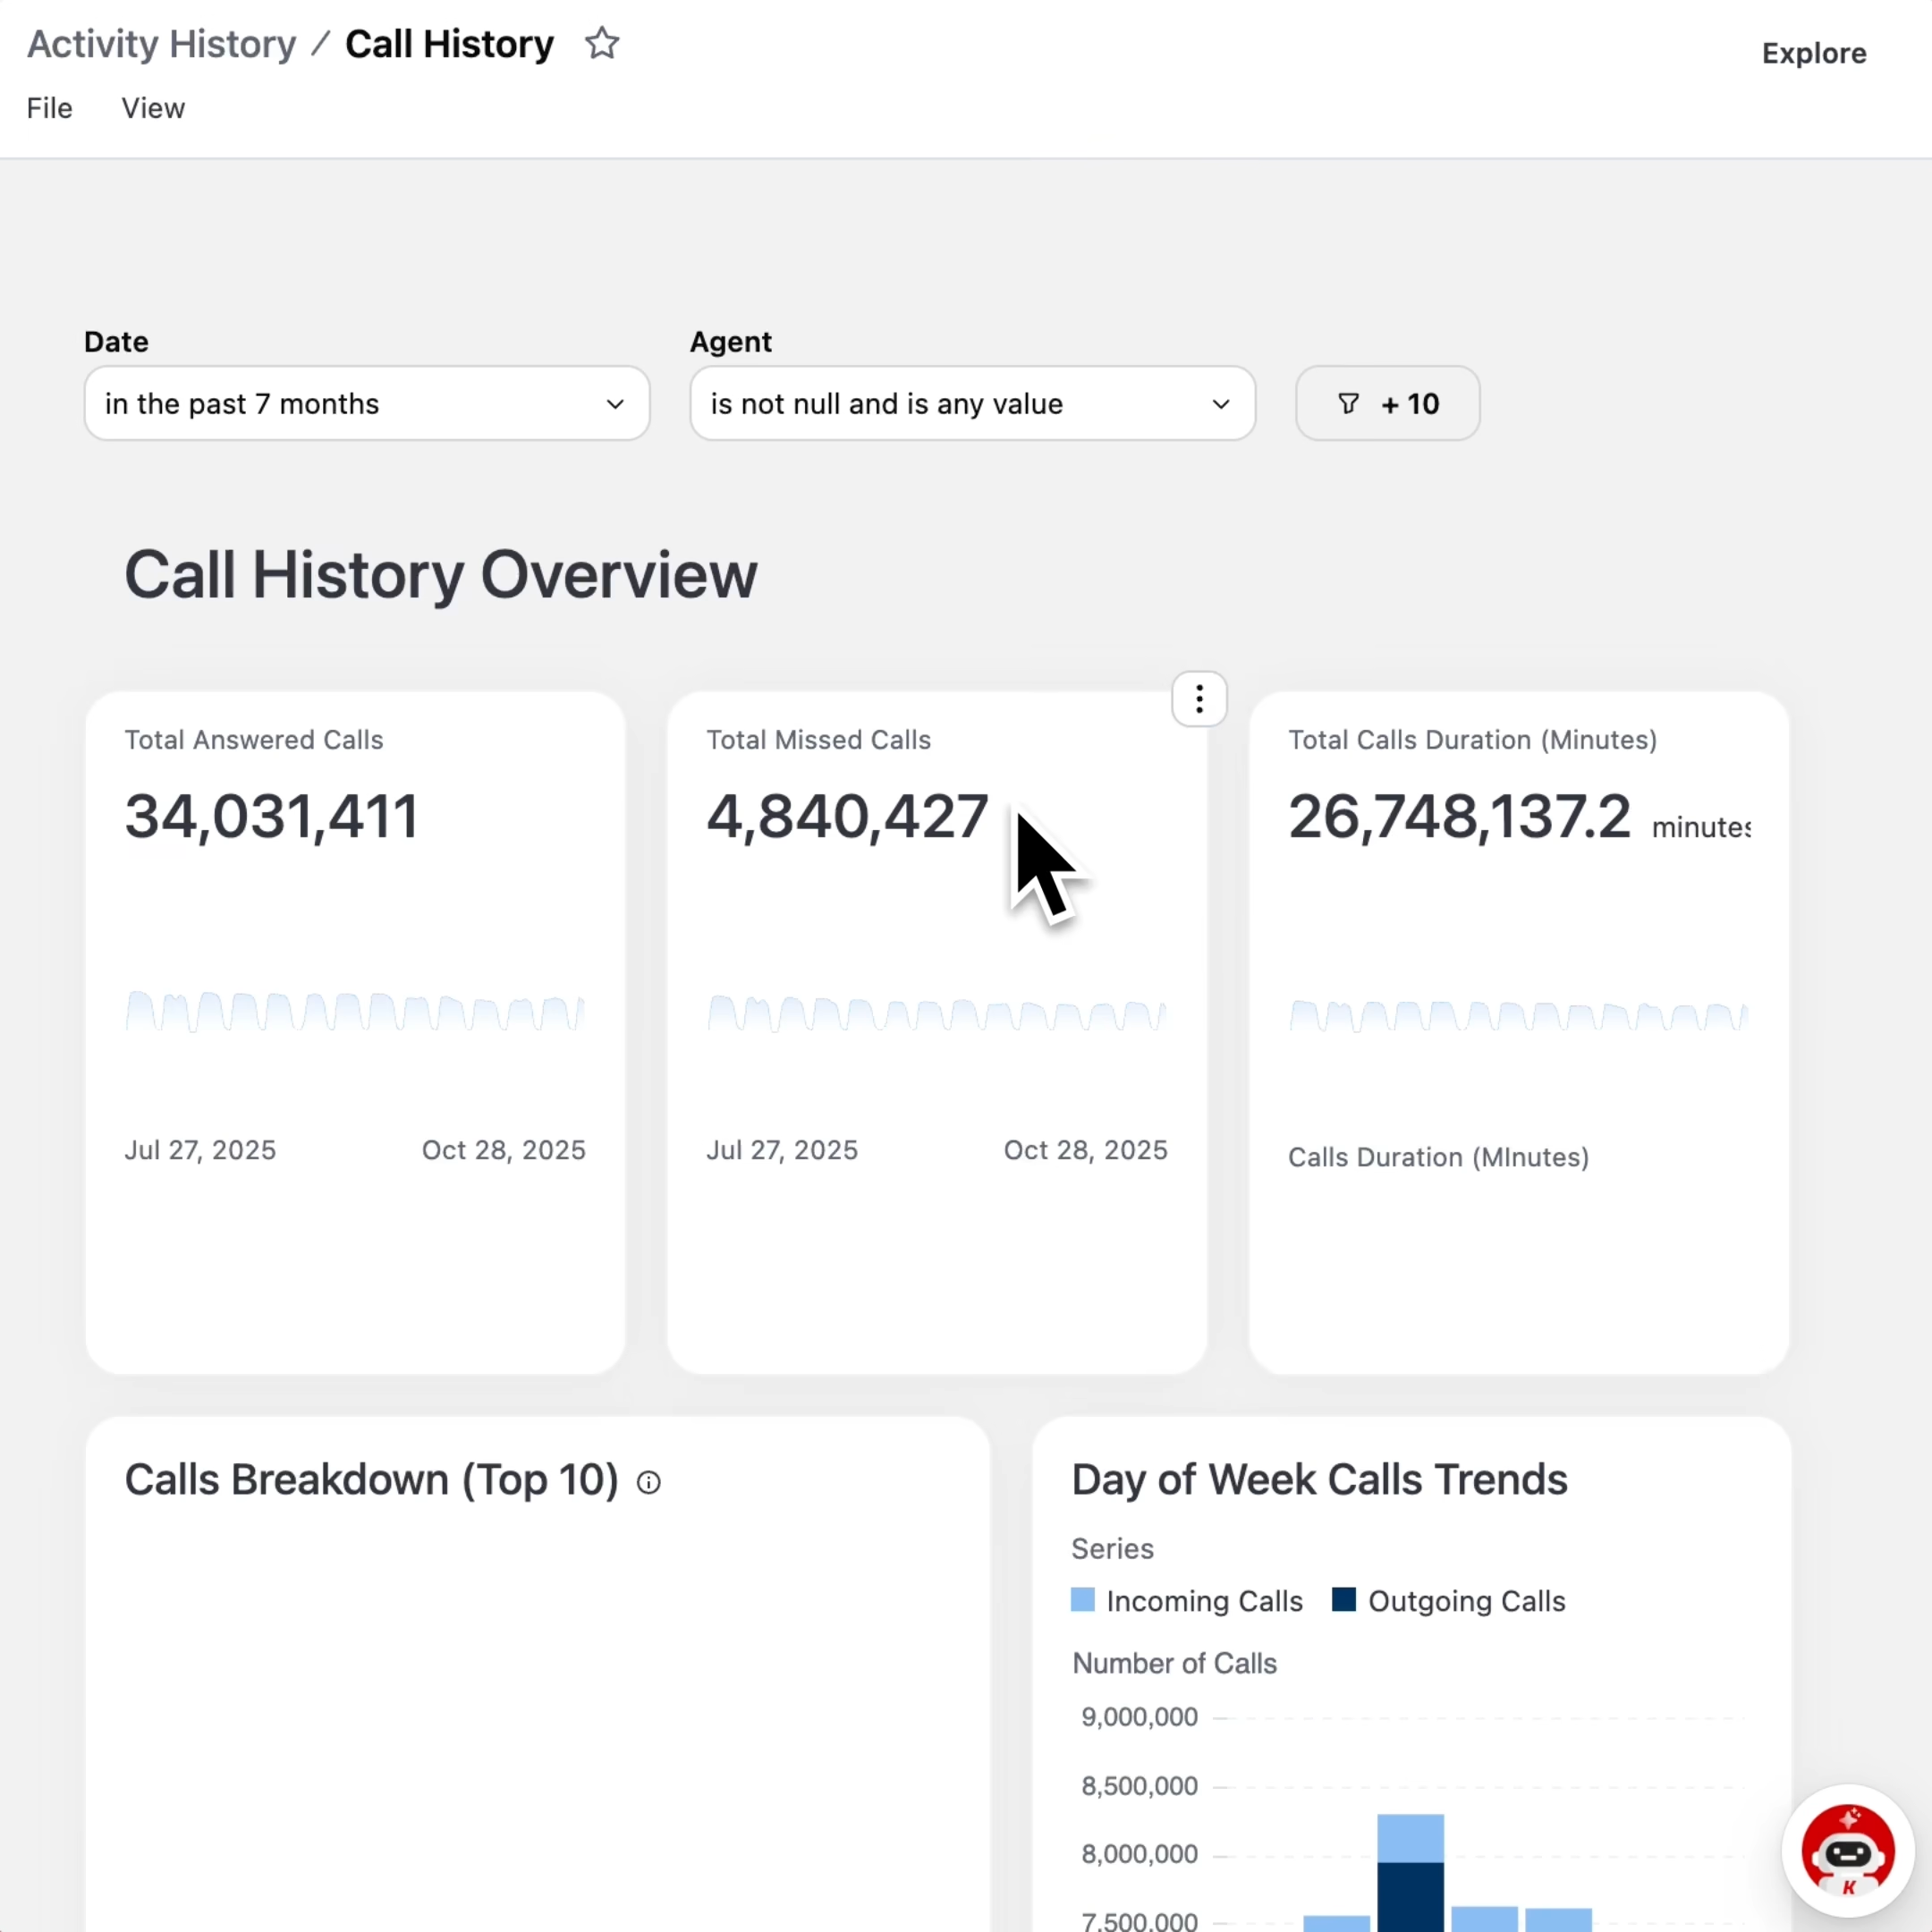
Out of the box you get three action-ready dashboards, designed to remove reporting friction and give your teams immediate visibility:

  • Call History - Total calls, missed vs answered ratios, response times, talk-time trends, and rep performance at a glance.)
  • SMS History - Message delivery, engagement, inbound/outbound patterns, and template/timing performance.
  • Connection Summary - True connection rates, timing patterns, and team-level reliability metrics to optimize scheduling and speed-to-lead.)

Kai — Conversational Analytics for Communications

Kai is a natural-language AI assistant that understands Kixie’s data model. Ask Kai plain-English questions like “Which reps improved connection rate this week?” or “Which SMS templates drive the most replies on Tuesdays?” — and Kai runs the queries, builds visuals, and returns concise, prescriptive insights in seconds.

Custom Report Builder — Test Any Hypothesis

The report builder (assisted by Kai) removes the technical gatekeeper. Want to test whether message length affects reply velocity for a vertical, or which call cadence yields the highest meeting rate? Build the report and run it against any field — calls, texts, dispositions, talk/listen ratios, outcomes — and get visual, shareable results you can act on.

Learn more about Kixie

Discover how Kixie can save you time and help you connect with more leads.

Try Kixie Free
No credit card required

Efficiency and Performance Trends

Kai instantly generates trends focused on optimizing performance, such as showing the highest answer rates, the most call duration, and identifying who is the most efficient.

Custom Logic & Deep Filtering

Beyond pre-built reports, the platform empowers users to model new ad-hoc dimensions and measures for custom logic, known as Custom Fields.

Real-Time Performance Engine with Actionable Alerts

Kixie’s new analytics engine is faster, deeper, and smarter than ever, ensuring every insight updates in real time. All results are built to be actionable.

I highly recommend using Kixie! Great software!


We are increasing sales velocity by listening to calls and giving feedback and coaching to our sales team. My team can also go back and listen to their own calls. We share calls amongst each other as well and ask for feedback. It has made us closer as a team, being able to share our strengths and weaknesses. The benefits we’ve realized are the gaps in our sales process and how we can improve to drive revenue into the business. Gina B. | Sales Development Manager

CRM Integration

Calling & texting integrated with any toolset.

Kixie has self-serve, out-of-the-box integrations with 25+ leading CRMs, helpdesks, conversation intelligence, automation platforms, and productivity tools. Webhooks and open API means our US-based team of experts will help you set up seamless integrations with thousands more.


Frequently asked questions

Got a question? We’ve got answers. If you have some other questions, contact us here.

Kixie AI (Kai) is the new AI report builder. It is an AI-Powered Reporting & Analytics Experience designed to provide analytics without complexity. Kai is a game-changing tool built because Kixie believes data should work for the user, not the other way around.

You can access Kai in the bottom right corner of any of your dashboards. With Kai, you can ask literally any question about your team’s performance in plain English. Kai will then work in the background to instantly build a live interactive report.

Kai can visualize a wide range of metrics and trends instantly. Examples include:

  • Who were the top performers over a specified period of data.
  • Which reps are closing the fastest this quarter.
  • Call outcomes visualized by specific criteria like industry or deal size.
  • Generating trends such as the highest answer rates, the most call duration, and identifying who is the most efficient.
  • Comparing rep performance across specific criteria, such as time zones or pipeline stages.

Yes. Once Kai generates initial data, you can ask it further questions to dive deeper into the results. Kai may also give you follow-up prompts that you can use to dive deeper. For instance, after seeing an initial summary, you can ask, “Can we break this down by day?”. Kai will then change the results or even recommend a different chart based on that follow-up query.

Yes. Kai can be used to help build out a brand new dashboard. To start, you select a topic, which is a subset of data (such as “calls” or “SMS”). You then ask Kai a question, and it will generate a query, populate results, and recommend a chart type based on your input.

Get started in 2 minutes, no credit card required

take a test drive